
A recent article in Kiplinger listed seven arts-related majors in its “15 Worst College Majors for a Lucrative Career” list, arguing that the ROI of a college degree depends on your major. Are college students listening to pundits like these who further the stereotype of the starving artist?
Gray looked at 2022-23 new student enrollment data in arts programs to find an answer; visual and performing arts programs came back after the pandemic, growing two percent year-over-year. (Note: all data is for fall and spring only). For comparison, overall new enrollment in academic programs was flat.
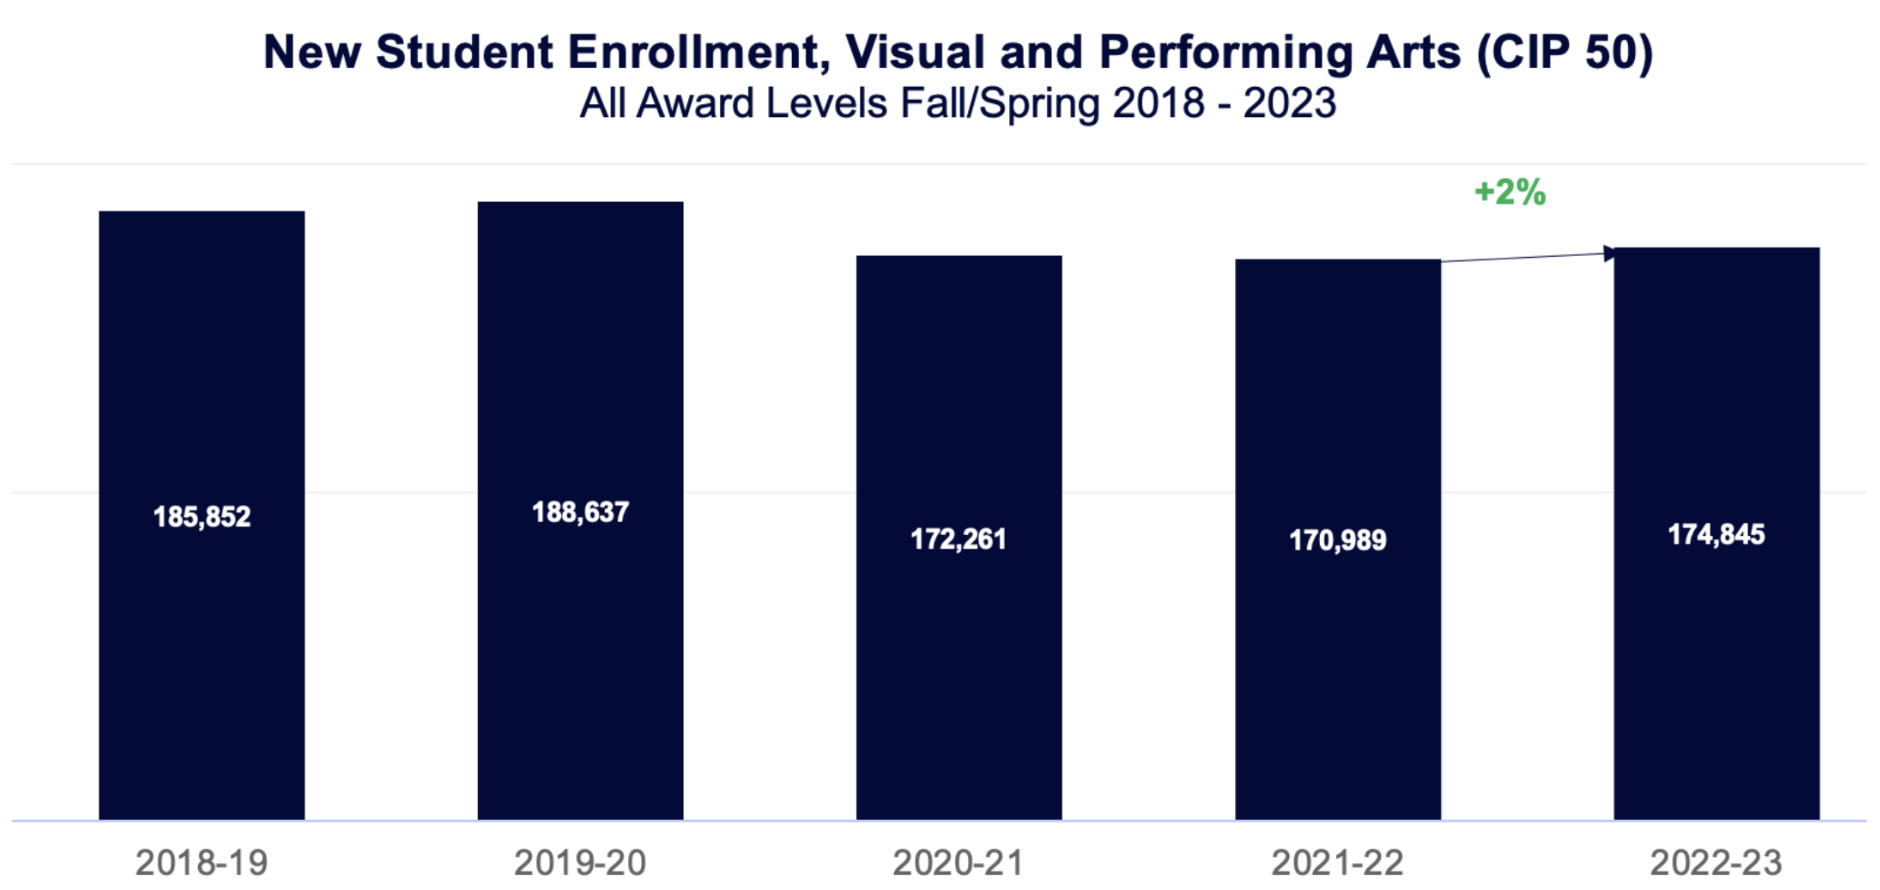
Source: Gray’s analysis of National Student Clearinghouse data
The recovery and growth are quite different for bachelor’s and master’s programs. Let’s take a look at the top performers at both award levels.
Bachelor’s Degree New Enrollment
In the academic year 2022-23, 95,510 new students enrolled in bachelor-level arts programs, a two percent increase from 2021/2022. Arts growth outpaced overall growth in all bachelor’s programs, where new enrollment fell one percent year-over-year.
Fastest-Growing Arts Program
Five fastest-growing arts programs were in traditional fine arts disciplines: Art History, Cinematography, Illustration, Fine/Studio Arts, and Music. Four of the programs were in design fields, and rounding out the list was Digital Arts. Of particular note, in the past year, Cinematography has been a top performer in enrollment and Google searches for academic programs.
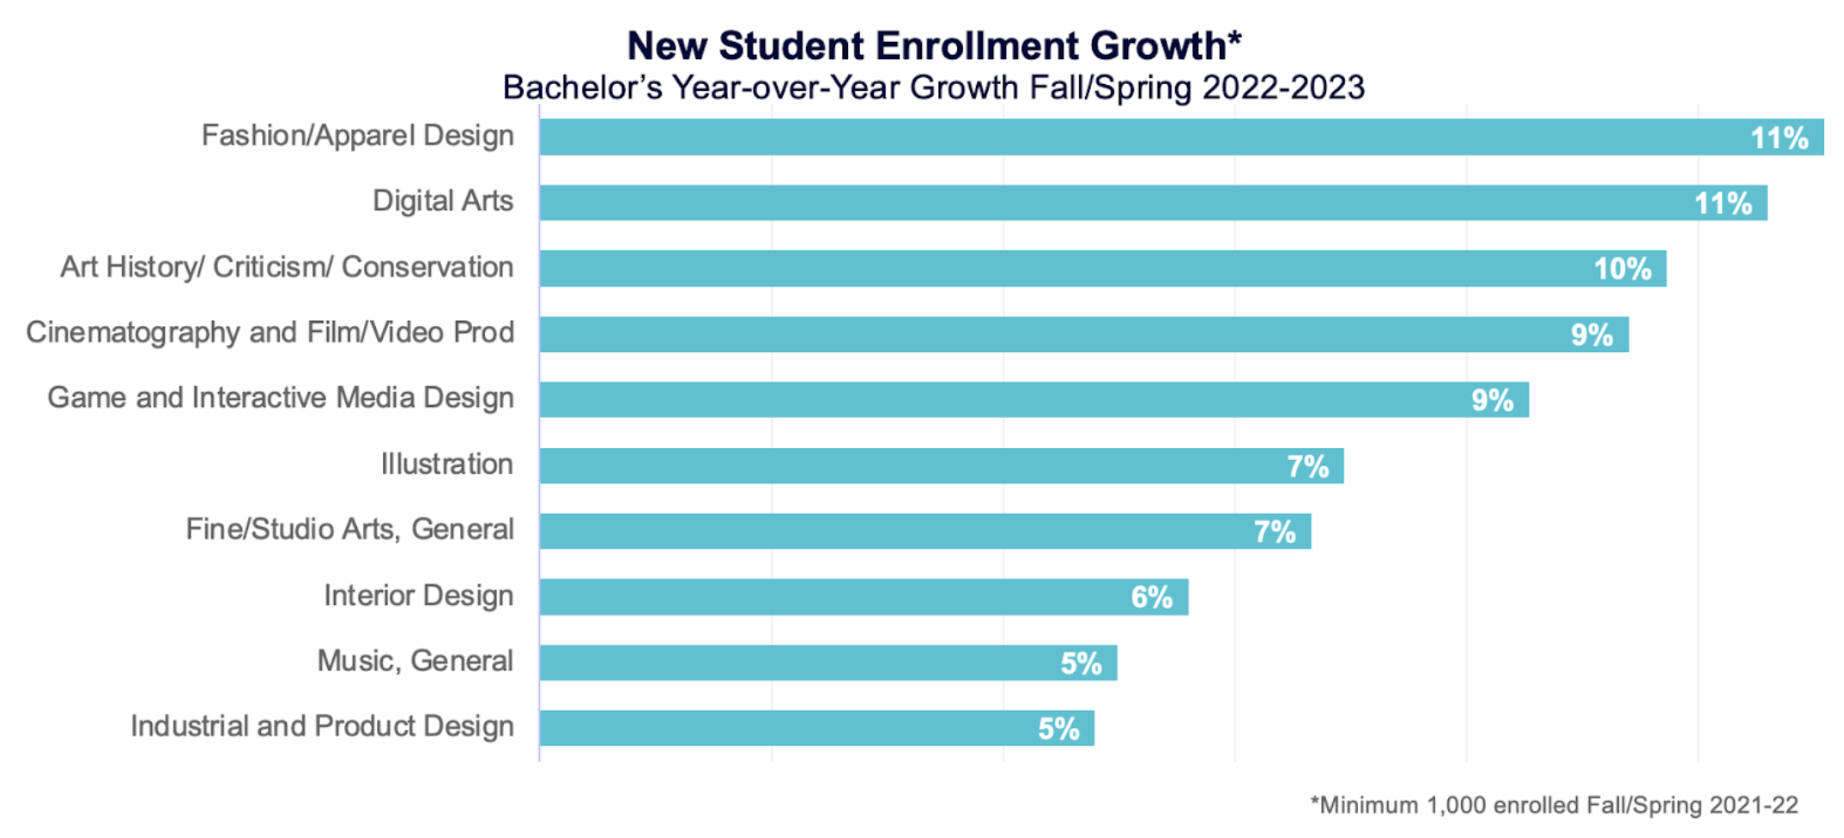
Source: Gray’s analysis of National Student Clearinghouse data
Master’s Degree New Enrollment
New enrollment in master’s programs in the arts is a different story: 17,522 new students enrolled, down nine percent year-over-year. This decline was on par with overall master’s new enrollment, which also fell nine percent. The good news is that five programs grew. Illustration, Industrial and Product Design, and Music also grew at the bachelor’s level.
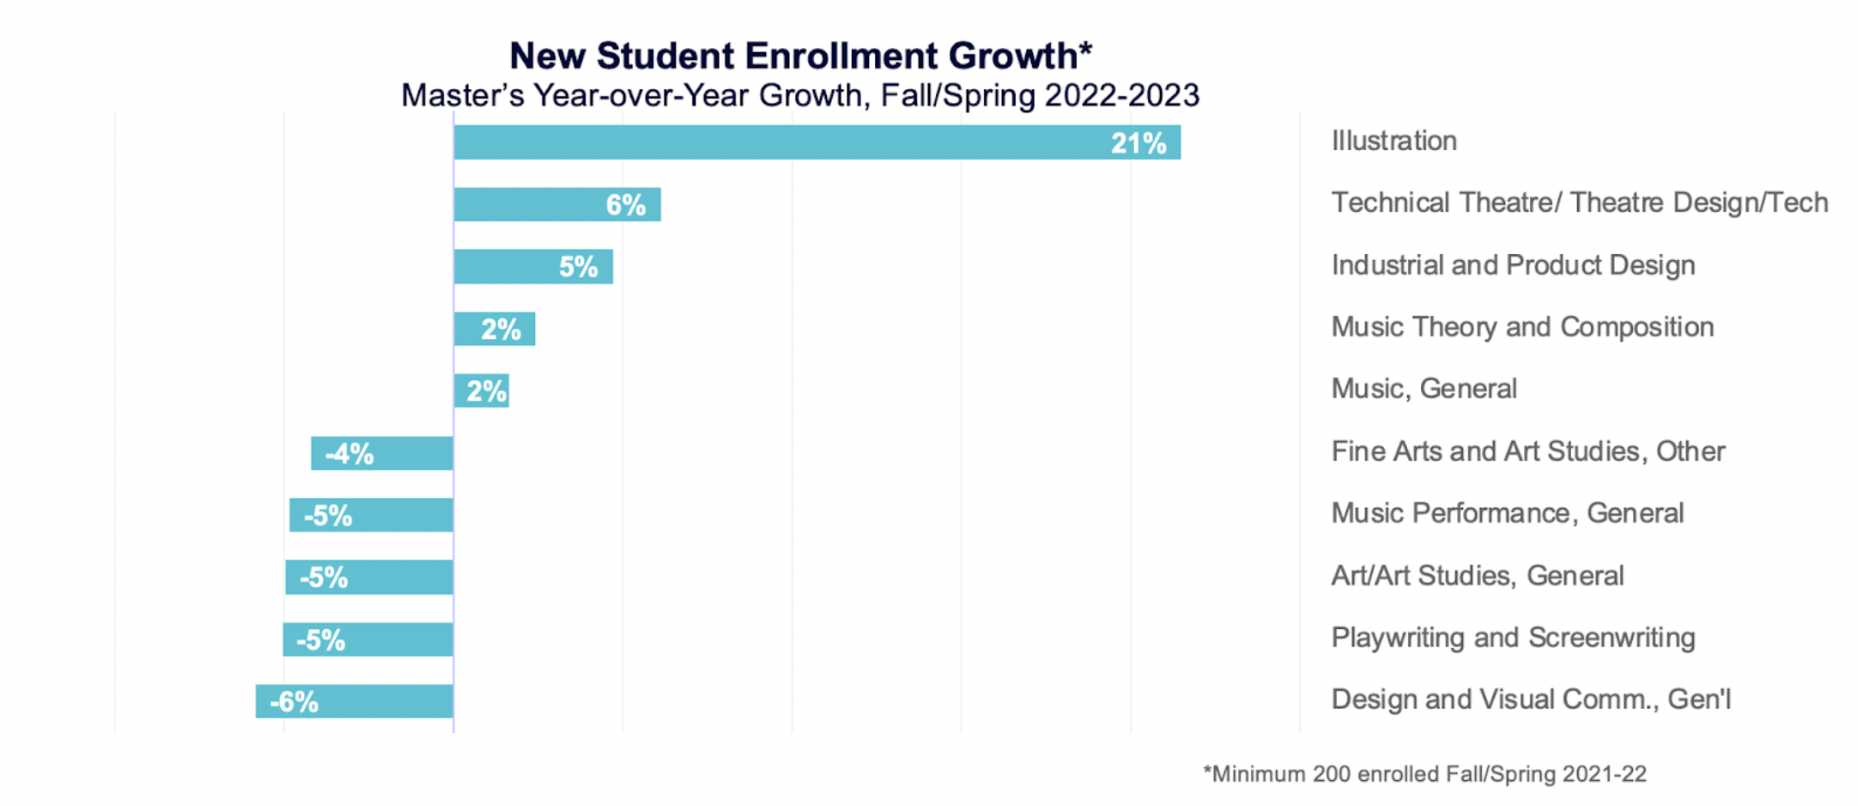
Source: Gray’s analysis of National Student Clearinghouse data
International and Non-Traditional Student Demand
Regarding international student interest, Design, and Visual Communications has been in the top 10 for program page views since December 2020. In June 2023, it beat Engineering/Engineering-related Tech, Social Sciences, and Education.
The arts aren’t just popular in traditional higher education. Gray mapped Coursera’s course parent categories to two-digit CIP codes from IPEDS, and visual and performing arts had the sixth-strongest cumulative enrollment in June 2023, beating traditionally dominant programs in higher ed: Health Professions and Related Programs and Physical Sciences.
Employment Outcomes for Arts Programs
The National Center of Education Statistics CIP SOC crosswalk is commonly used to analyze outcomes, including the number of jobs and wages available for graduates. It is a “direct prep” crosswalk, which assumes that jobs should only be counted if NCES economists believe they are directly related to the major. For example, according to NCES, if a student graduates in fine arts, there are three occupations they can pursue: Art, Drama, and Music Teachers; Artists and Related Workers; and Fine Artists, including Painters, Sculptors, and Illustrators.
Gray analyzed data from the US Census American Community Survey (ACS) and found that only seven percent of fine arts graduates go into fields they were directly prepared for. According to the Bureau of Labor Statistics, Bachelor of Fine Arts graduates earn an average salary of $55,000; the average for all college graduates is $65,000. However, ACS reports that fine arts graduates earn an average salary of $66,100 – over $1,000 more than all college graduates. Additionally, three of the top 10 occupations fine arts graduates enter make over $78,000: Marketing Managers ($91,300), Web Developers ($88,100), and Market Research Analysts ($78,300).
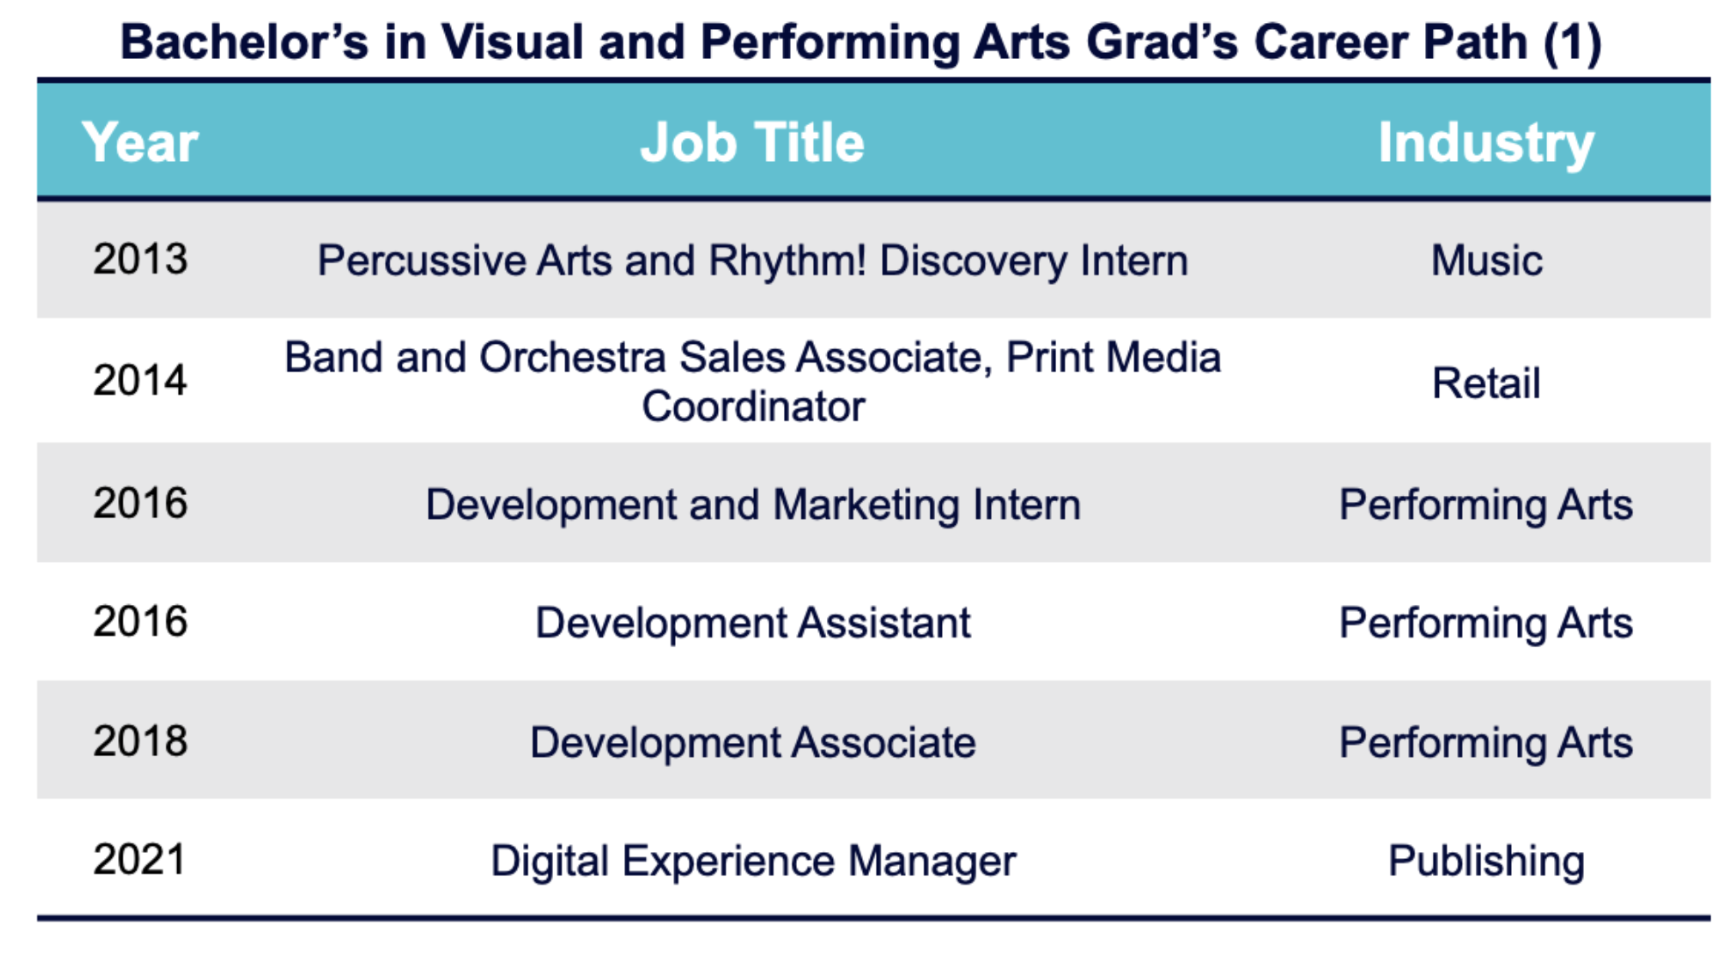
We also analyzed alumni data from a People Profile Data source, discovering that fine arts graduates’ career paths vary widely. The following charts illustrate two career paths (note: these individuals did not attend graduate school in the period shown).
The first example below illustrates a somewhat traditional path for a Visual and Performing Arts graduate. This individual was employed in the performing arts industry but in sales and marketing positions. The most recent job was in marketing management in the publishing industry.
This second graduate did not go into fields they were directly prepared for. Seven years after graduating, this individual worked mainly as an executive assistant, business analyst, and operations manager in industries unrelated to the arts.
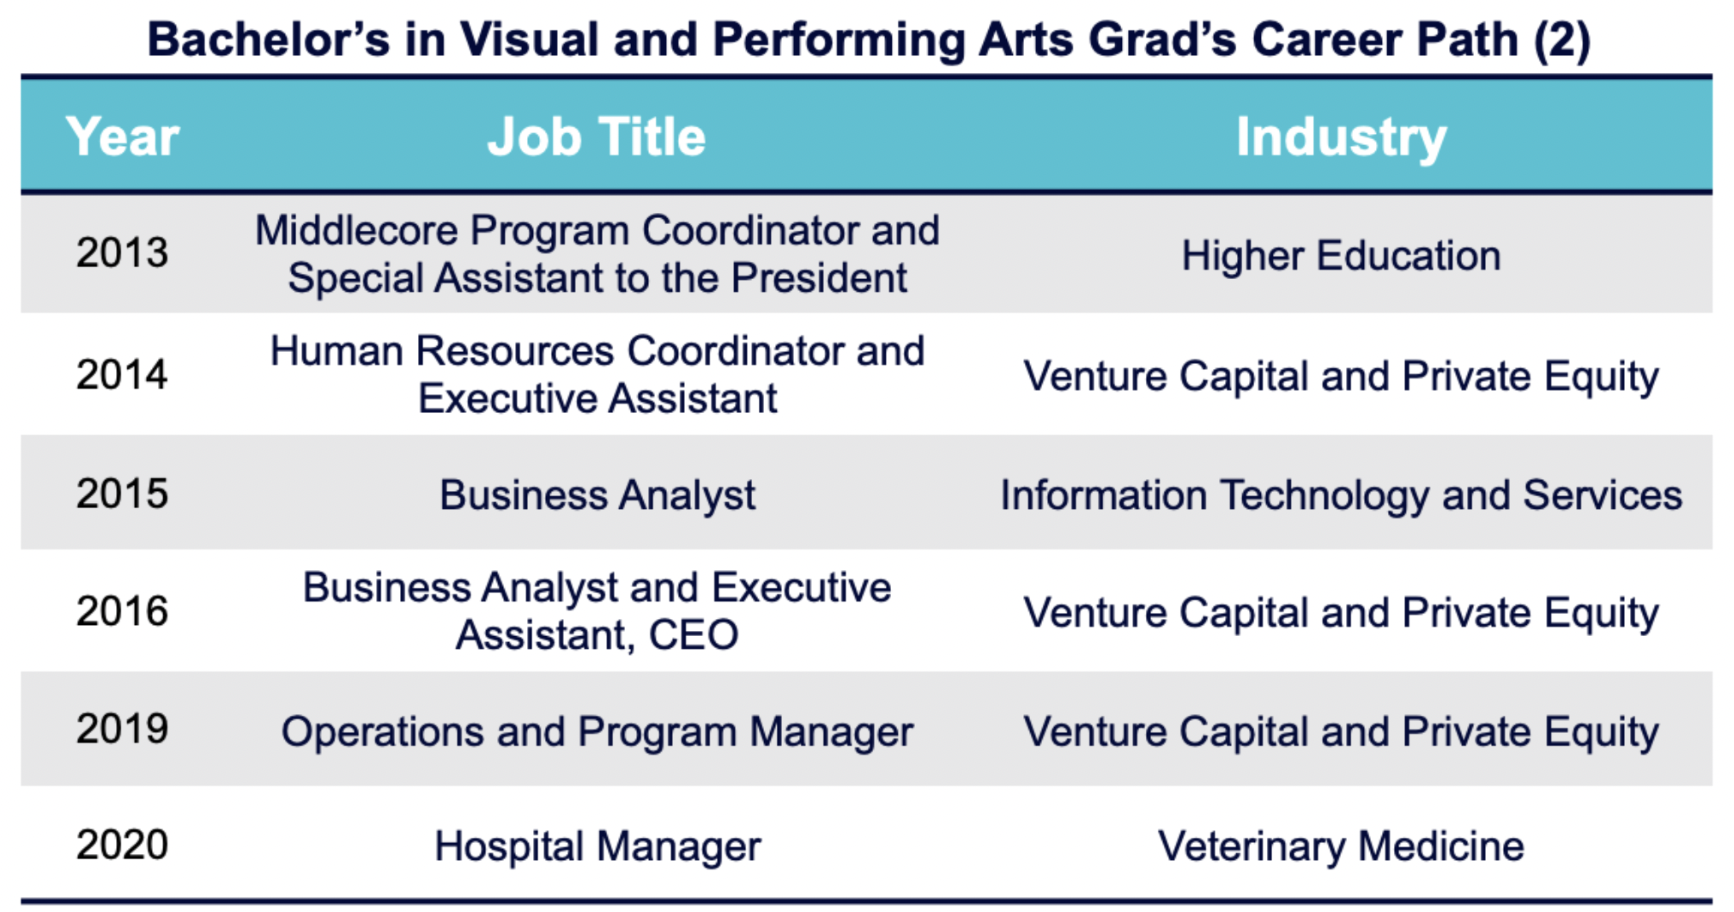
Source: Gray Analysis of People Profile Data
According to Gray’s data, for the most part, new enrollment in arts programs is not slowing down; it is outpacing overall new enrollment growth. Doomsday reports like Kiplinger’s about low-paying careers for graduates are not based on the reality that most graduates do not become starving artists: in our example, 93 percent of fine artists are employed in other fields, eventually go to grad school, and earn above average wages.
Anti-arts pundits, take heed. Demand for arts programs, especially at the bachelor’s level, is growing in higher education, and there is employment data you can use to guide your students into fulfilling, lucrative careers.
Would you like a more in-depth analysis of arts programs to start, stop, or grow? Send us a quick note.