The Course-Cost Trap: Why Averages Don’t Reflect the True Cost of Growth
Understanding course costs requires more than averages. Explore how incremental cost analysis can improve program planning, budgeting, and growth decisions.
Average class size is one of the primary factors driving cost per Student Credit Hour (SCH). But average class size is a bit of an over-simplification: in my home office, my dog and I together have an average of three legs, but that doesn’t really represent either of us very well.
Here’s an example that illustrates the range at an institution that does not have any really big lectures:
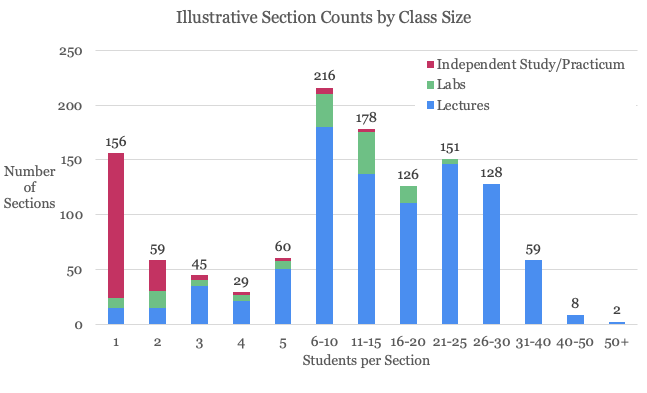
Note that, even after excluding independent studies, this institution still reports 179 sections with five or fewer students. As the provost at a different institution said to me earlier this week, “If we have only two Accounting majors, I still have to offer all the courses they need to graduate.”
For the example above, 216 classes – the biggest cluster – have six to ten students per section. Half the lecture sections have fewer than six or more than 25 students.
If the 60 sections of 5 students were adjusted to match the institution’s median of 15 students per class, the number of sections would drop from 60 to 20. Assuming an average teaching load of 8 classes per year, dropping 40 sections would save approximately $500,000 per year 1 in full time faculty costs. If the sections were taught by adjuncts at $2,000 per section, the savings would be $80,000.
So, how can an institution reduce the number of smaller sections? Here are some of the opportunities Gray’s clients have identified and implemented:
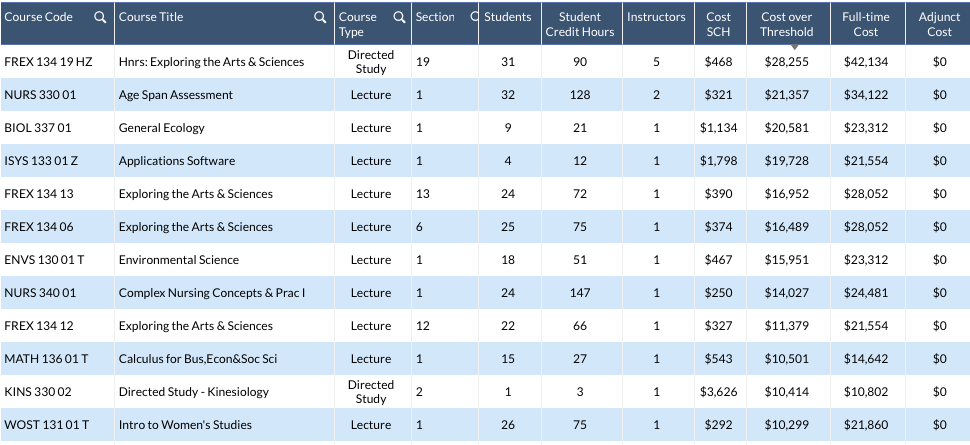
Identifying these opportunities is much easier – and avoiding false cost-savings actions that don’t actually reduce costs – with the right data at hand. This is a screenshot from Gray’s PES+ Economics tool, which makes an institution’s curricular efficiency data accessible to the people who need it.
Note that all the opportunities described above typically arise during routine, recurring decision processes: course scheduling for each term, annual hiring requests, requests for independent studies each term, etc. So the key to improving and sustaining curricular efficiency is improving the processes for these routine decisions. This includes providing useful data, at a relevant level of detail (course and section within department), in a format that makes it easy for the decision-makers to consider these factors as one important set of considerations. It includes ensuring that the decision makers know how to access and use this data. And it necessitates that the institution’s senior administrators, when they assess proposed decisions that affect curricular efficiency, insist that these decisions reflect economic information and the institution’s strategic priorities as well as traditional considerations.
1.This estimate assumes a reduction of 40 sections and 8 sections per faculty member. The reduced course load would require five fewer faculty, at an average of $100,000 in wages and benefits per faculty member.
Understanding course costs requires more than averages. Explore how incremental cost analysis can improve program planning, budgeting, and growth decisions.
Gray DI was cited in the Lexington Herald-Leader as part of Kentucky State University’s academic program review and reorganization process.
Higher education is changing fast, and the signals are getting harder to ignore. From surging demand for AI and cloud skills to shifting enrollment and employer needs, institutions that move quickly and strategically will be best positioned for what’s next.

Stop navigating enrollment droughts and budget drains in the dark. Join Gray DI’s free Master Class Series and unleash data-informed insights to transform your academic portfolio.
Limited seats available!