
The familiar story of the blind men and the elephant is an apt description of how people view a college or university. Stand next to an elephant’s leg and you see a sturdy post. Grab the tail and you feel a rope. Get sprayed by the trunk and you think of a spouting hose. Of course, none of these myopic views is much help in describing the elephant. Nor should the university be viewed myopically—e.g., as a set of departments, a collection of programs and courses, various faculty and staff groupings, or an administrative and support bureaucracy.
Making good policy and resourcing decisions requires knowledge about how a campus’s many parts depend on and influence one another. In other words, what’s needed is an understanding of the university as a system. This blog presents a conceptual framework for exactly that.
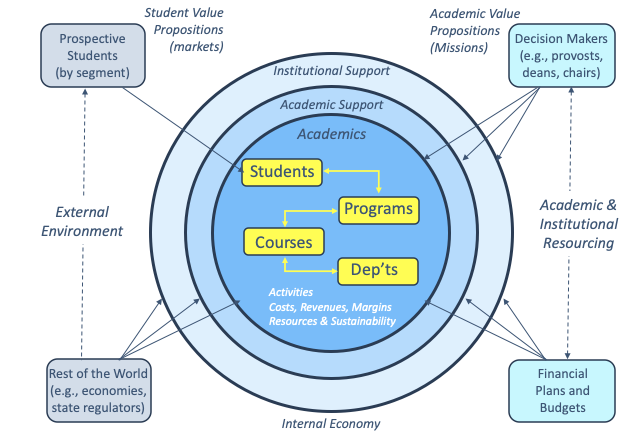
The framework is depicted by the concentric circles (the university’s “internal economy”) in the diagram below. Items outside the circles represent the external economy and the resourcing environment. I’ll describe the framework in terms of a simulation model that, when grounded in data for a particular institution, will inform the scenario planning approach described in my “Finding a Sustainable Academic Strategy.” Gray is developing just such a model, but the lessons to be discussed below depend on the concepts rather than the particulars.
Academic Activities
By “activity” I mean the tasks performed by faculty, staff, and students as they pursue their teaching objectives. Thinking in terms of tasks and their associated behavior patterns is essential for understanding the university. Frameworks that simply allocate costs and revenues among programs, courses, and departments are dangerously oversimplified. Among other things, they provide no insights about the factors that influence the educational quality, student success (or lack of it), and the sustainability of the university’s operations.
Let’s start with the students, whose enrollments animate the rest of the system. (Research is important too, and it is included in the model, but it would unduly complicate the discussion here.) Choice of program looms large in most students’ selection of a school, so the first interaction to be considered is the strength of an institution’s various programs in the marketplace. Understanding requires the acquisition of market knowledge: e.g., about student interest, employment prospects for graduates, and competition. The demand data will vary across subgroups of the student population, so the achievement of diversity goals requires attention to the market segments that are attracted by each program.
Program-level decisions include whether to grow, shrink, or sunset particular offerings—and also the tuition and discount rates and the sums to be invested in marketing. These result in realized levels of student intake and, after adjustment for retention, the demand for courses and earning of revenue. In summary, programs interact with the market to produce revenue and, depending on their curricula, the demand for particular courses.
A good analysis will illuminate the course-taking behavior of students in each of the institution’s programs (or, better, the behavior student segments). The core of such analyses is the so-called “course-by-program enrollment (or credit hour) matrix”, which can be obtained from student registration data. The model predicts course enrollments by summing across the columns of this matrix, then estimates the number of sections required for each course based on school and departmental policies. Direct course costs are calculated from the section and enrollment counts.
Costs, Revenues, and Margins
The next step extracts data on the net revenue (after subtracting university aid grants), as realized for each student, from the university’s financial system. This maps to the programs in which the students are registered. (Revenue from students who have not selected a major can be assigned to a special “undeclared” or “general education” program.) The program revenue is assigned to courses, and the course costs back to programs, in proportion to enrollments or credit hours. In short, revenues follow students, and thus programs, and costs follow courses.
Subtracting the direct costs from the revenues produces the teaching contribution margins for each program and course. Aggregating these quantities over the courses taught by each department (or splitting them in the case of jointly-taught courses) finishes the analysis. Departmental overheads (e.g., chairs, administration, and perhaps unsponsored research time) are added to the direct teaching to costs complete the picture.
Notice that costs, revenues, and margins are built up from the activities, not the other way around. And because the activities are analyzed at a very detailed level (the individual course or course or course section, and perhaps also by student segment), all the quantities can be sliced and diced in whatever way is desired.
We’ve considered only the direct costs of teaching so far, but it’s only a short step to add in the economics of academic and institutional support activities (the outer concentric circles in the diagram). One can use standard accounting methods to allocate these expenses to programs, courses, and departments—e.g., by using their costs, credit hours, or faculty/staff FTEs as drivers. The overheads can be partitioned if desired: for example, to target marketing, student services, and facilities costs to the areas receiving the most benefit. (Some models include courses’ usage of particular facilities in the direct cost of teaching.)
Resources and Sustainability
What remains is to link direct academic costs to expenditures on the resources “consumed” by the activities, and to consider whether such “consumption” will be sustainable over time. faculty time is the most critical resource. The salary, benefits, and support costs of regular faculty FTEs (and the per-course cost of adjunct faculty) are not difficult to obtain. However, the time distribution of regular faculty requires careful consideration.
Faculty don’t (and shouldn’t) punch time clocks, but reasonable analyses can be based on estimates of the time required for contact and non-contact teaching tasks in various kinds of courses, a school’s guidelines for normal teaching load, and the approximate fractions of time expected for teaching, service, and research and scholarship. These quantities allow the calculation of cost per section and per enrollee for individual courses, as discussed above.
Sustainability has many facets, but the degree to which the teaching loads of regular faculty members exceed a reasonable guideline clearly is one of the most important. Many commentators believe that teaching loads have been creeping up in many institutions as a result of curricular expansion and financial stringency. Failing to recognize that this kind of stress is not sustainable over long periods is just one reason not to accept a myopic view of “the elephant.”