
Is your school’s athletic department making decisions based on both internal and external data? Schools need to evaluate the sports teams they will offer and the conference in which they will participate. They often rely upon internal data, such as win-loss records, revenues from ticket sales and merchandise, and expenses from coaches’ salaries, team travel, equipment, etc. The use of external data is often neglected. Benchmarking teams against others in their conference or peer group can aid in strategic resource decision making.
Below is an example of benchmarking expense data for women’s ice hockey in the Hockey East Association Conference. Since Covid-19 forced the season’s cancellation for some teams, we have used pre-pandemic data from the 2018-2019 academic year.
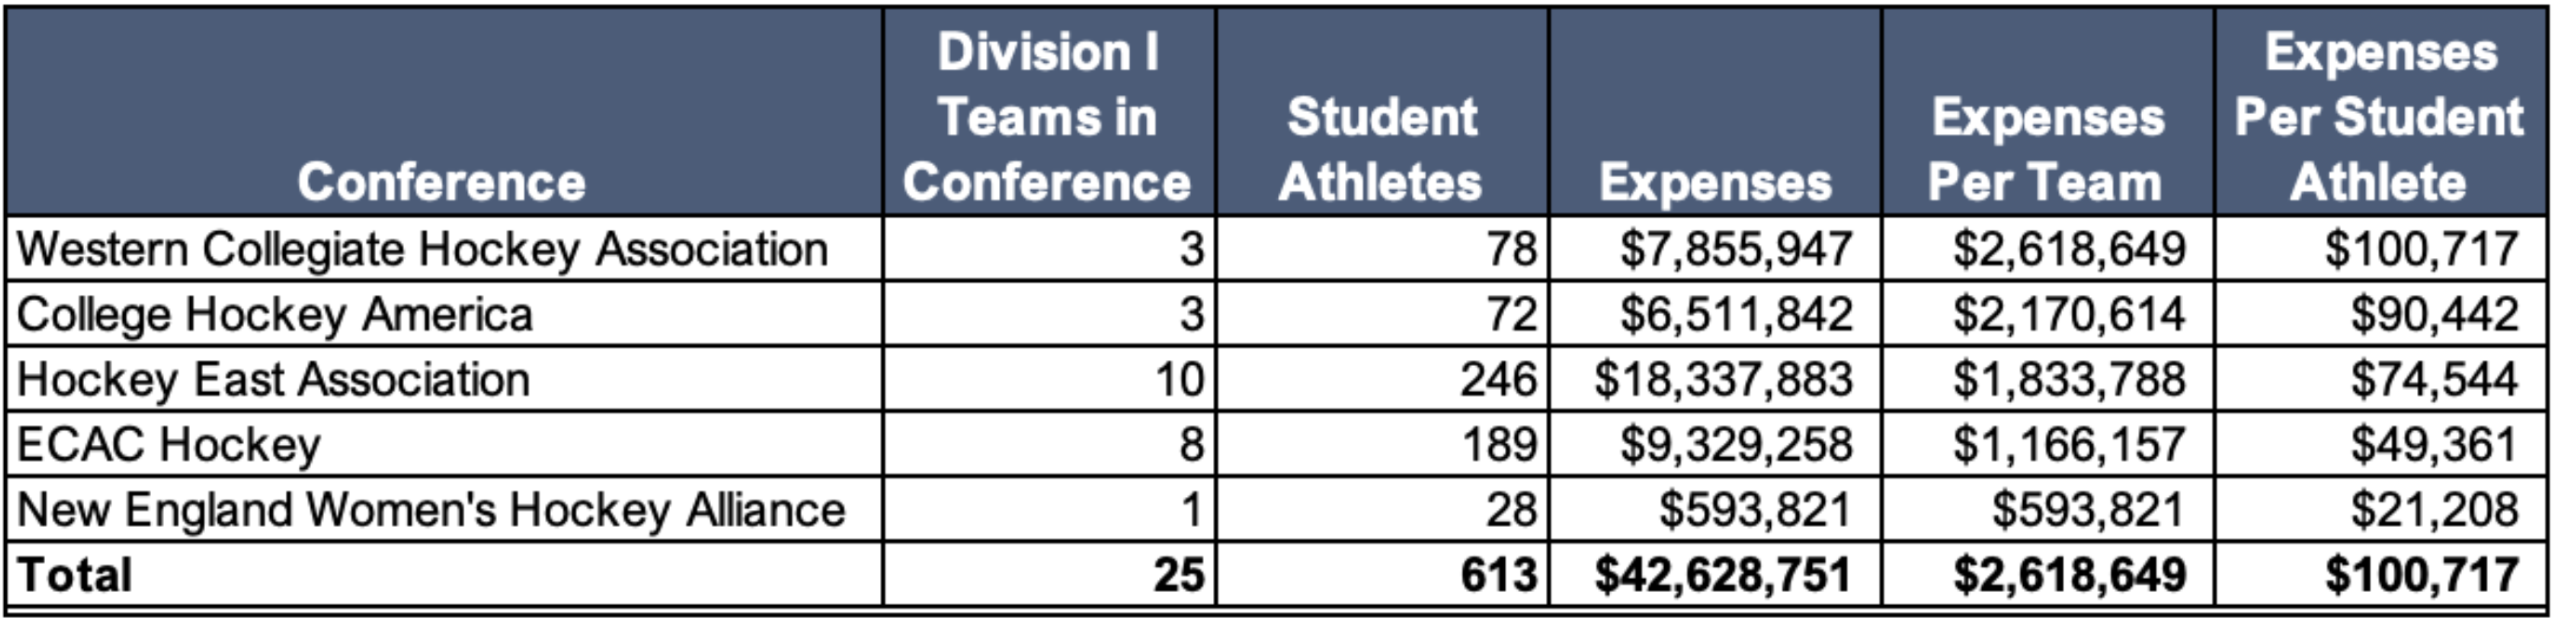
Conference Comparison
Several hockey teams participate in a hockey conference separate from the school’s primary conference for other sports. For example, the University of Minnesota is a member of the Big Ten for other sports. However, the Big Ten does not offer women’s hockey; therefore, its women’s hockey team joined the Western Collegiate Hockey Association.
Of all the Division I women’s hockey conferences, the Hockey East Association has the largest representation, with 10 teams and 246 student athletes. It is at the median in terms of expenses per team and per student athlete.
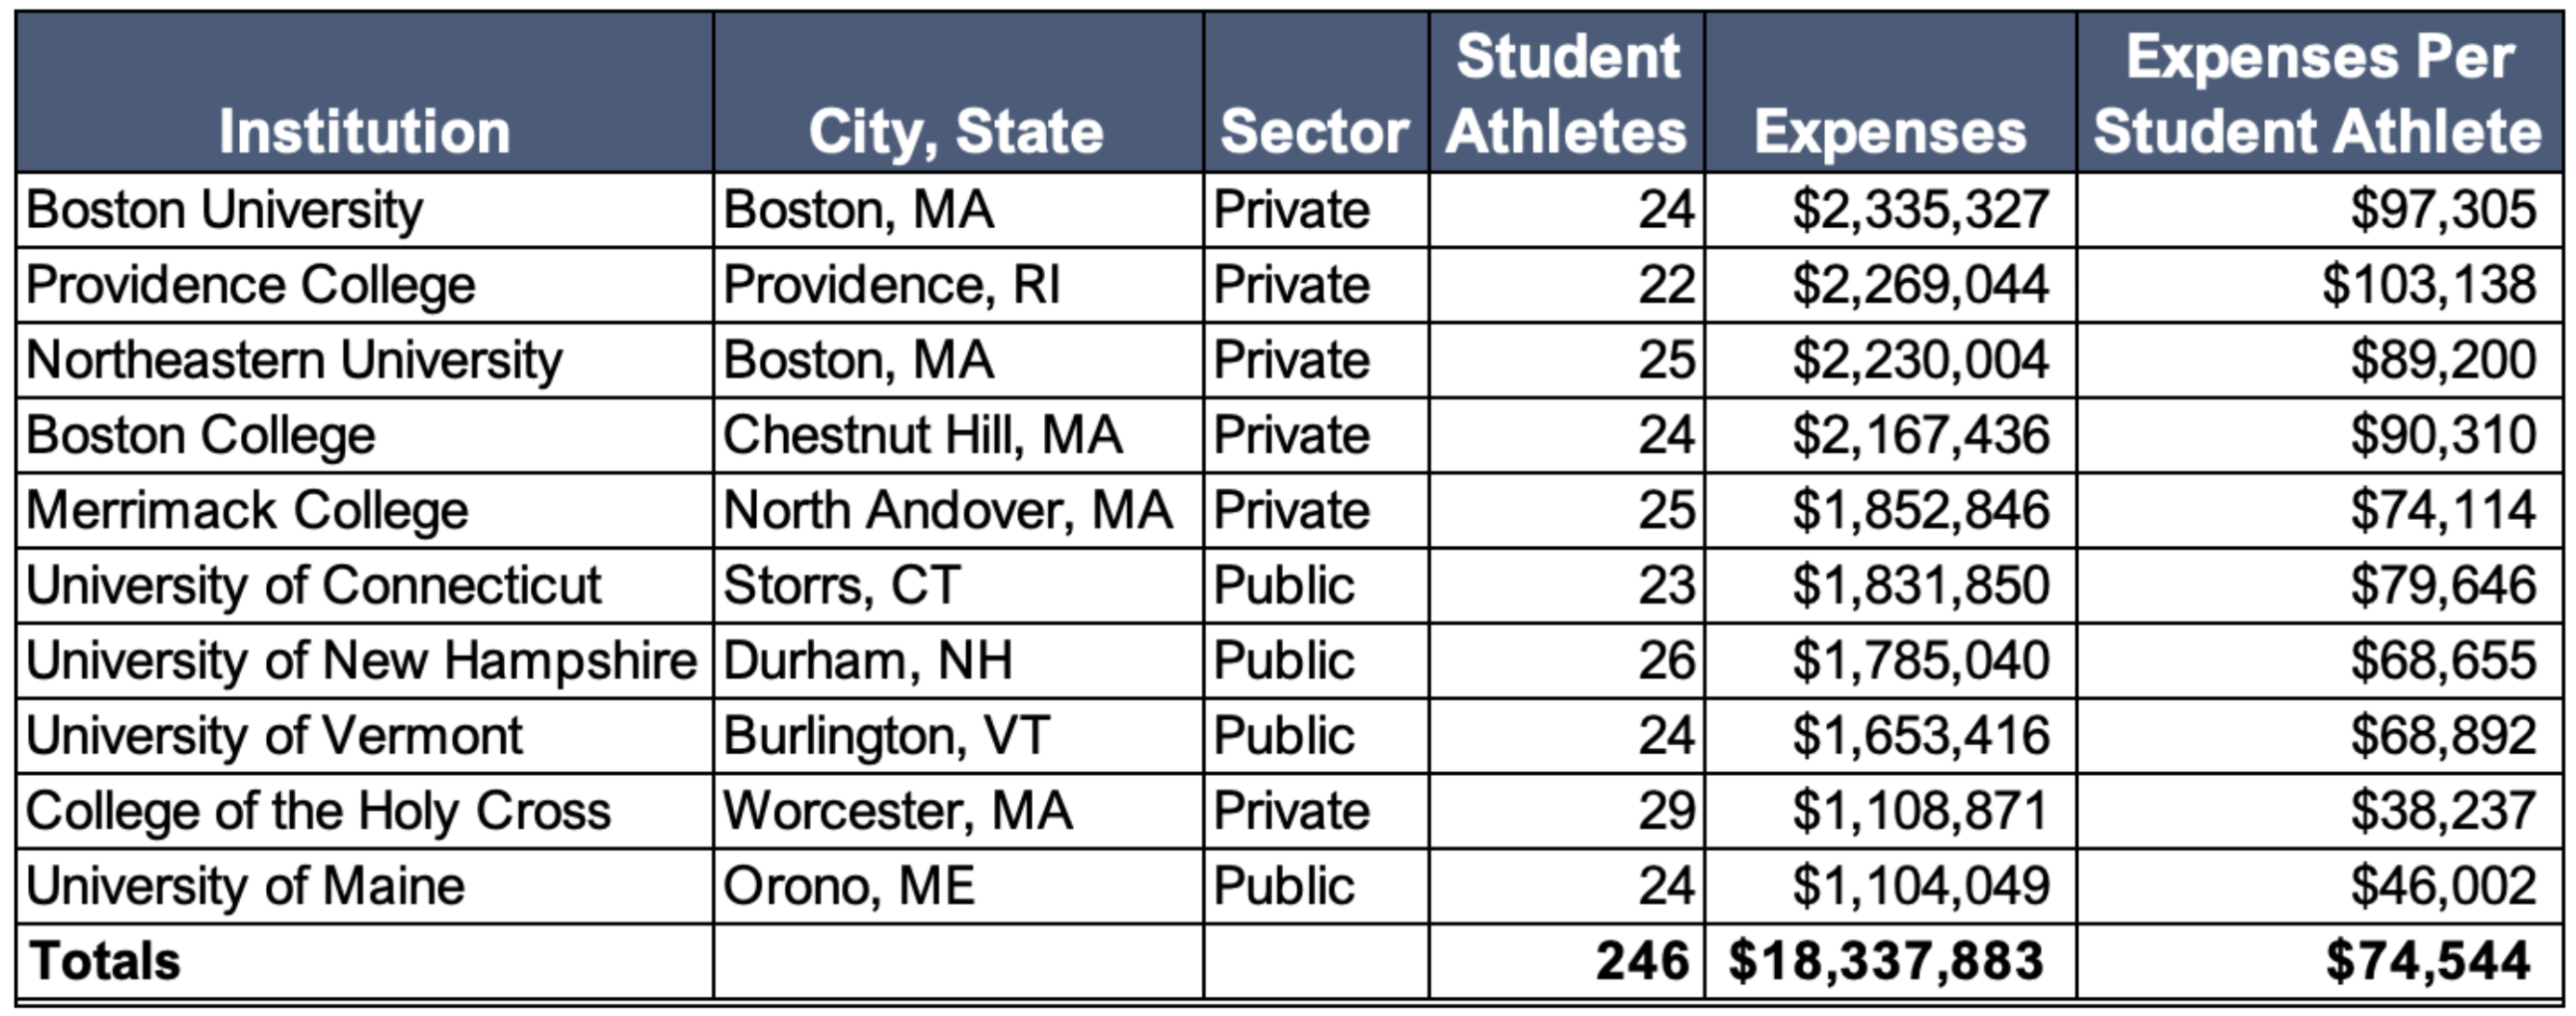
Hockey East Association Participation and Expenses
The average roster size was 24.6 student-athletes and 3.6 coaches. Teams averaged $1.8 million in expenses or $75,000 per student-athlete. Below is a breakdown of total expenses by team. Expenses include appearance guarantees and options, athletically-related student aid, contract services, equipment, fundraising activities, operating expenses, promotional activities, recruiting, salaries and benefits, supplies, and travel.
Benchmarking can be applied at schools considering a conference change or just looking to add new sports based on market demand and program economics. Data is available for schools at Division I, II, III, or community college levels and for men’s, women’s, and coed sports. These decisions also affect enrollment in academic programs as certain sports attract students who major in specific programs.
Through benchmarking, schools can understand how they rank in terms of cost per participant, cost per sport, etc. This enables them to assess what sports are performing well versus the ones that need further assistance. Would you like to size up your school’s athletic team expenditures relative to your competition? Click here to learn more.