Why You Need Varied Data Sources: Evaluating Student Demand Data for Associate Programs

enrollment data

June 14, 2022

Graduation is over, and most students have left campus.  What lies ahead this summer for academic program decision-makers?  The likely priority is fall enrollment, especially for community colleges:  enrollment has declined the sharpest in associate programs over the past two years.  How can you evaluate which new and existing programs to invest in?  Or cut?

The Correct Data Sources to Evaluate Program Enrollment

Enrollment is only one student demand metric you need to evaluate your program portfolio.  Low completion rates are harmful to institutional finances and students.  Gray pulled the top ten associate program completions from IPEDS data to see what students completed in 2020.  We excluded Liberal Arts, General Studies, Business, and Registered Nursing since those consistently top the list.


2020 US Top Completions Associate Degrees and Below


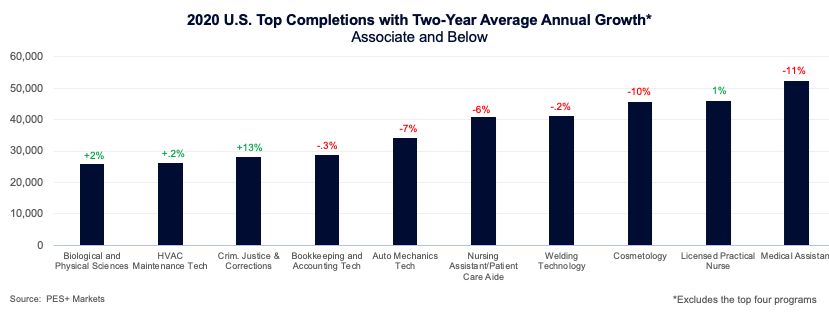
There are limitations in relying solely on IPEDS to evaluate programs.  As of spring 2022, the most recent update was for 2020 completions.  Even more importantly, students selected these associate programs at least one year prior, in 2019 – before the pandemic.

National Student Clearinghouse enrollment data is more current.  We looked at the Fall 2021 enrollment of new students.

US Fall 2021 First time enrollment Associate degrees and below

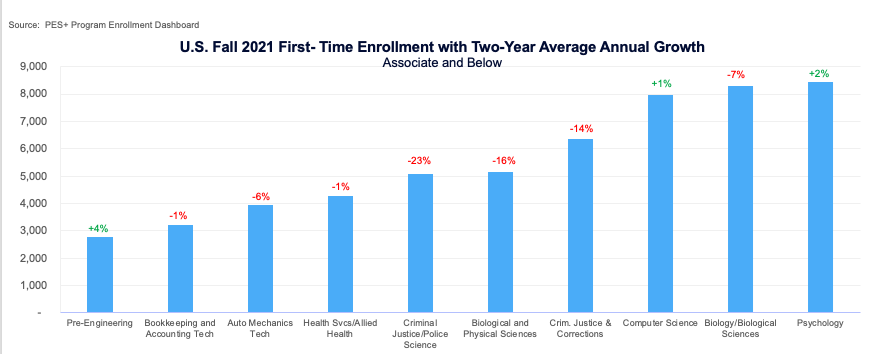
There is some overlap between Fall 2021 first-time enrollment and 2020 completions:  Biological/ Physical Sciences, Criminal Justice and Corrections, Bookkeeping/Accounting Tech, and Auto Mechanic Tech are in the top 10 for both metrics. That overlap provides more information to measure market demand.

Growth metrics are also key. Medical Assistant, the top program in completions volume, had the highest decline in annual growth at 11 percent. It’s also not in the top program enrollments.

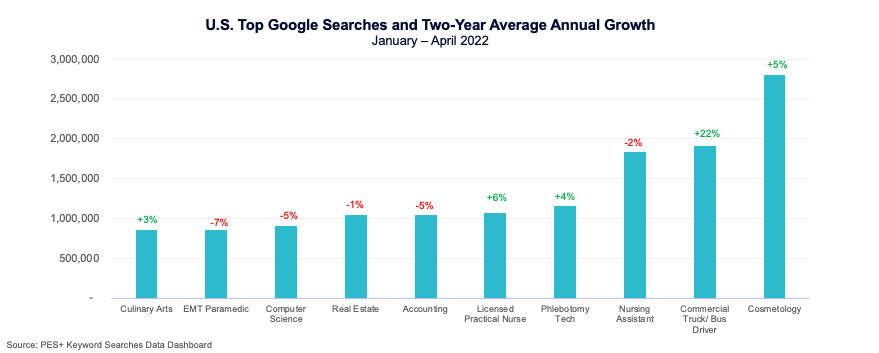
Google Keyword searches are the most up-to-date and can tell us what students are looking for now. Cosmetology consistently has the highest search volumes. Commercial Truck and Bus Driver has grown 22% year-over-year from January to April; however, it is not strong in enrollment or completions. The current spike in growth may be related to existing supply chain issues and employer demand.


Top google searches and two-year annual growth


Multiple Data Sources Reveal the Whole Story

Three metrics for enrollment data

What happens when we use all three metrics instead of one?

Searches, enrollment and completions
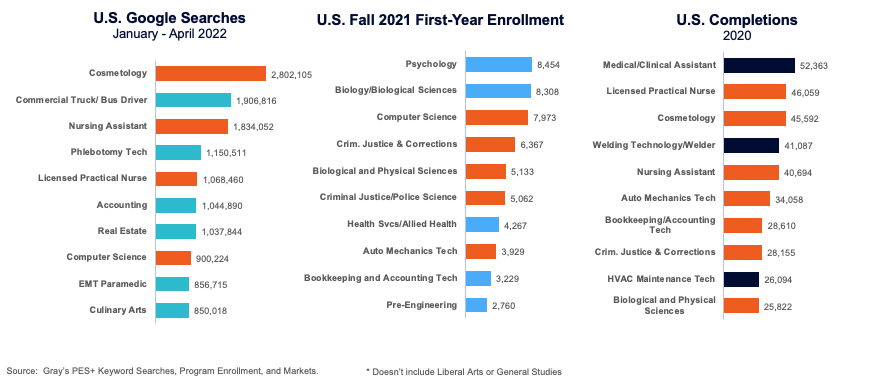
The orange bars signify there is some overlap in metrics for that program.  The rest only appear in one metric.  What can we conclude by looking at associate programs across all three metrics instead of just one?

The chart shows that students are searching for Computer Science programs and enrolling in them, but these students are completing at a lower rate.  Licensed Practical Nurse and Nursing Assistant have high Google search volumes and are strong in completions, although Nursing Assistant has declined in growth.

Licensed Practical Nurse has a strong and growing Google search volume in 2022.  It’s also growing in completions.  Bookkeeping/Accounting Tech is strong in enrollment and completions, and Accounting is strong in searches.  Auto Mechanics Tech decreased growth in enrollment and completions.

The bottom line: If you are using a single data source to review your academic program enrollment, you are not getting the whole picture and could be missing out on several opportunities.

Monica Bilson

Senior Project Manager

Monica produces webinars and conference presentations, contributes to blogs, and manages internal projects for senior leadership. She is the designer and manager of Gray DI's course with Bay Path University, Academic Program Evaluation and Management.

About Gray DI

Gray DI provides data, software and facilitated processes that power higher-education decisions. Our data and AI insights inform program choices, optimize finances, and fuel growth in a challenging market – one data-informed decision at a time.

Related Posts
Subscribe to Our Blog

Don’t miss our latest research and insights

Related Posts

Gray Data

Using Data to Rebuild Trust and Confidence in Higher Education

Public trust in higher education is declining—but the data tells a different story. From lifetime ROI figures to real-world alumni outcomes and program-level financial performance, explore how institutions can use transparent, relevant data to show the enduring value of a college degree. Learn how to shift the narrative, build confidence among students and stakeholders, and make the case for higher education with evidence, not assumptions.

Read More
Gray Data

April 2025 Higher Ed Program Trends: What’s New, What’s Next

As student interests and workforce demands continue to evolve, colleges are responding with a wave of innovative new programs — and April 2025 was no exception. From AI doctorates to short-form credentials in trades and tech, institutions are rethinking not just what they offer, but how they deliver it. Explore the latest trends shaping academic portfolios, and see how schools are using program launches as strategic levers for growth, access, and relevance.

Read More
Gray Data

The AI Education Boom: Masters Lead the Charge, Community Colleges Join the Fray

AI education is booming—and it’s not just for tech giants or elite institutions. From soaring master’s degree enrollment to cutting-edge associate programs at community colleges, schools across the country are rapidly expanding AI offerings to meet rising employer demand. Explore the data behind this surge, the surprising role of community colleges, and what institutions should know to stay ahead in preparing tomorrow’s AI workforce.

Read More