
Master the Academic Program Evaluation Process
DATA-INFORMED STRATEGY FOR HIGHER ED LEADERS.
Navigate shared governance, evaluate program health, and align your academic portfolio with student demand and institutional mission. Gray DI provides the framework and market data to help higher education leaders make confident, transparent decisions.
Bring clarity, speed, and consensus to academic portfolio planning.

What Is an Academic Program Evaluation Process?
An effective Academic Program Evaluation System (PES) is data-informed, transparent, collaborative, and comprehensive. It bridges hard data with institutional judgment and shared governance.
Establishing a formal process reveals high-potential programs that merit investment to grow enrollment and revenue, speeds up time-to-market, and optimizes ROI—all while upholding your institution’s mission.
Shared Governance Over “Closed-Door” Decisions
Top-down decision-making creates friction. Long-term success requires broad, transparent stakeholder engagement.
Top-down or “closed-door” decisions create friction and erode trust across campus. A data-informed evaluation process respects shared governance by bringing faculty, deans, provosts, and institutional leaders to the same table.
- Build Campus Trust. Align stakeholders around shared, objective metrics.
- Strengthen Buy-In. Ensure institutional leaders and faculty co-own decisions.
- Speed Up Execution. Reduce internal friction when launching or scaling programs.
Holistic Program Data Coverage
Evaluating a program on a single metric creates dangerous blind spots. Sustainable strategy requires looking at markets, margins, and student performance together.
Evaluating a program on a single metric creates dangerous blind spots. A complete 360° evaluation requires analyzing three critical lenses simultaneously:
- Academics. Track student demand, course efficiency, retention, and graduation rates.
- Markets. Assess regional student demand, employer hiring trends, and competitive intensity.
- Margins. Understand true financial contribution and program margins to avoid misallocating capital.
Data Informs, Human Experience Drives
Analytics are foundational, but numbers alone aren’t enough. Institutional knowledge provides essential context.
Data should inform leadership judgment, not automate or replace it. Sustainable success happens when analytical rigor meets institutional knowledge.
- Pair Data with Nuance. Leverage domain expertise from department heads and faculty.
- Uphold Campus Mission. Factor in community impact, accreditation, and institutional values.
- Prompt Better Questions. Use data as a conversation starter rather than an automated decision maker.
Systematic & Ongoing Program Reviews
Evaluation isn’t a one-off crisis response. Continuous reviews build long-term portfolio resilience.
Program evaluation shouldn’t be an emergency drill triggered only by budget shortfalls or demographic dips.
- Proactive Management. Establish a continuous, predictable cadence for portfolio health checks.
- Operational Agility. Adapt to shifting career trends before enrollment declines hit.
- Long-Term Resilience. Safeguard your institution against broader economic downturns.
Active Lifecycle Management
All academic programs evolve. Even staple general education courses require continuous updates to stay healthy.
Every academic program moves through a natural lifecycle of growth, maturity, and saturation.
- Continuous Optimization. Routinely refresh foundational general education courses to maintain student engagement.
- Clear Decision Criteria. Define objective triggers for when to invest, pivot, or sunset offerings.
- Resource Reallocation. Shift capital from declining programs into high-demand emerging disciplines.
The 4 Core Pillars of Academic Program Evaluation
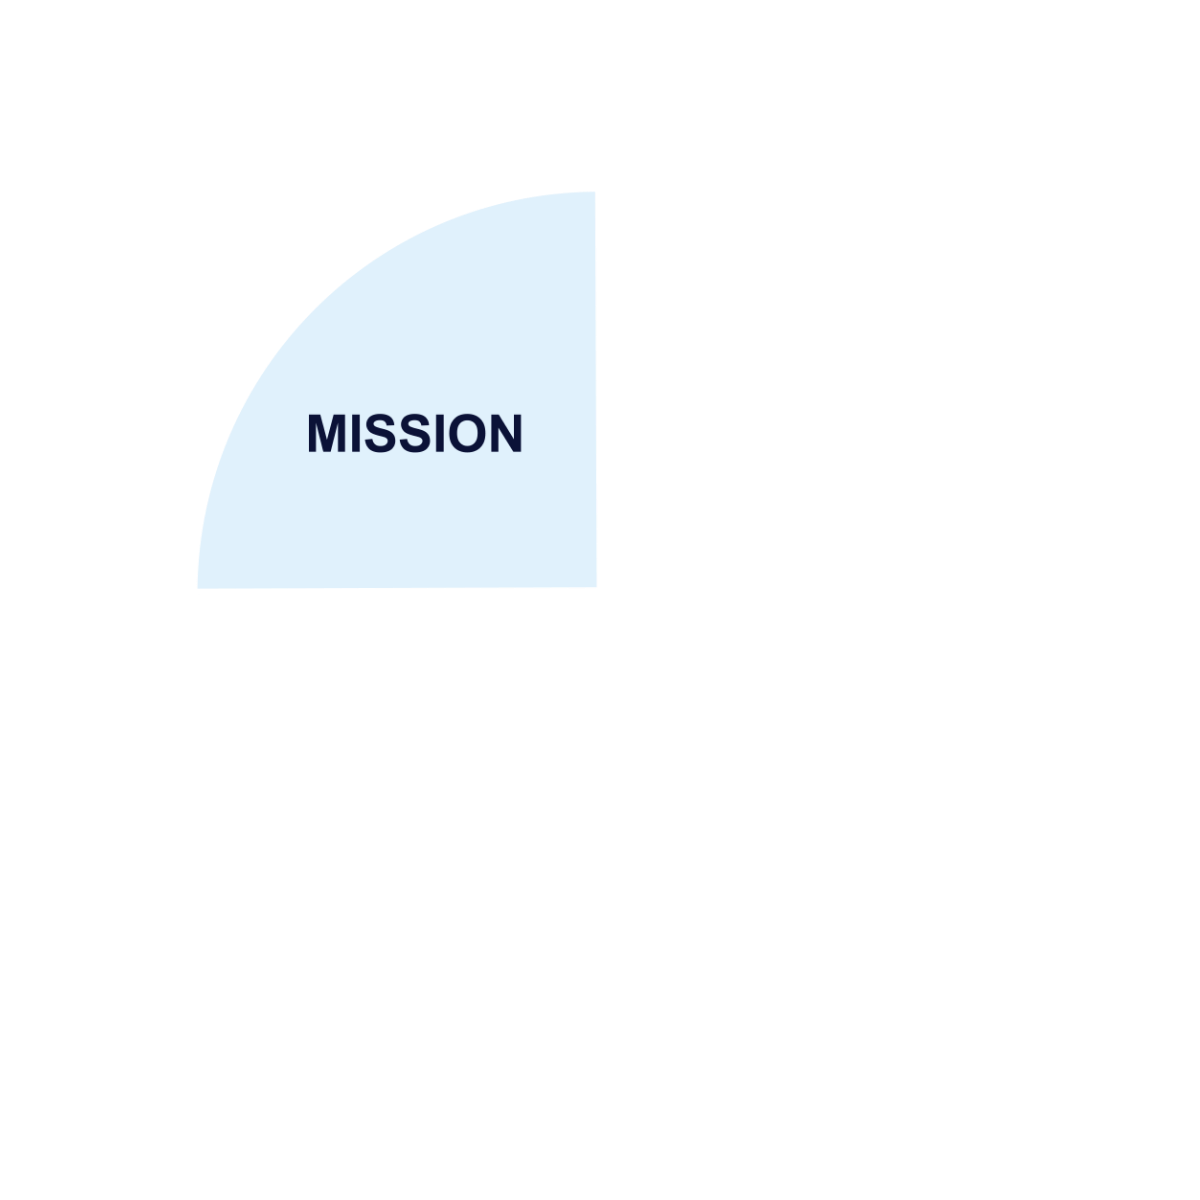
To gain a complete, actionable view of your academic portfolio, evaluations must look beyond simple enrollment numbers. A robust evaluation framework rests on four interconnected pillars: balancing internal success, external market demand, competitive positioning, and financial health.
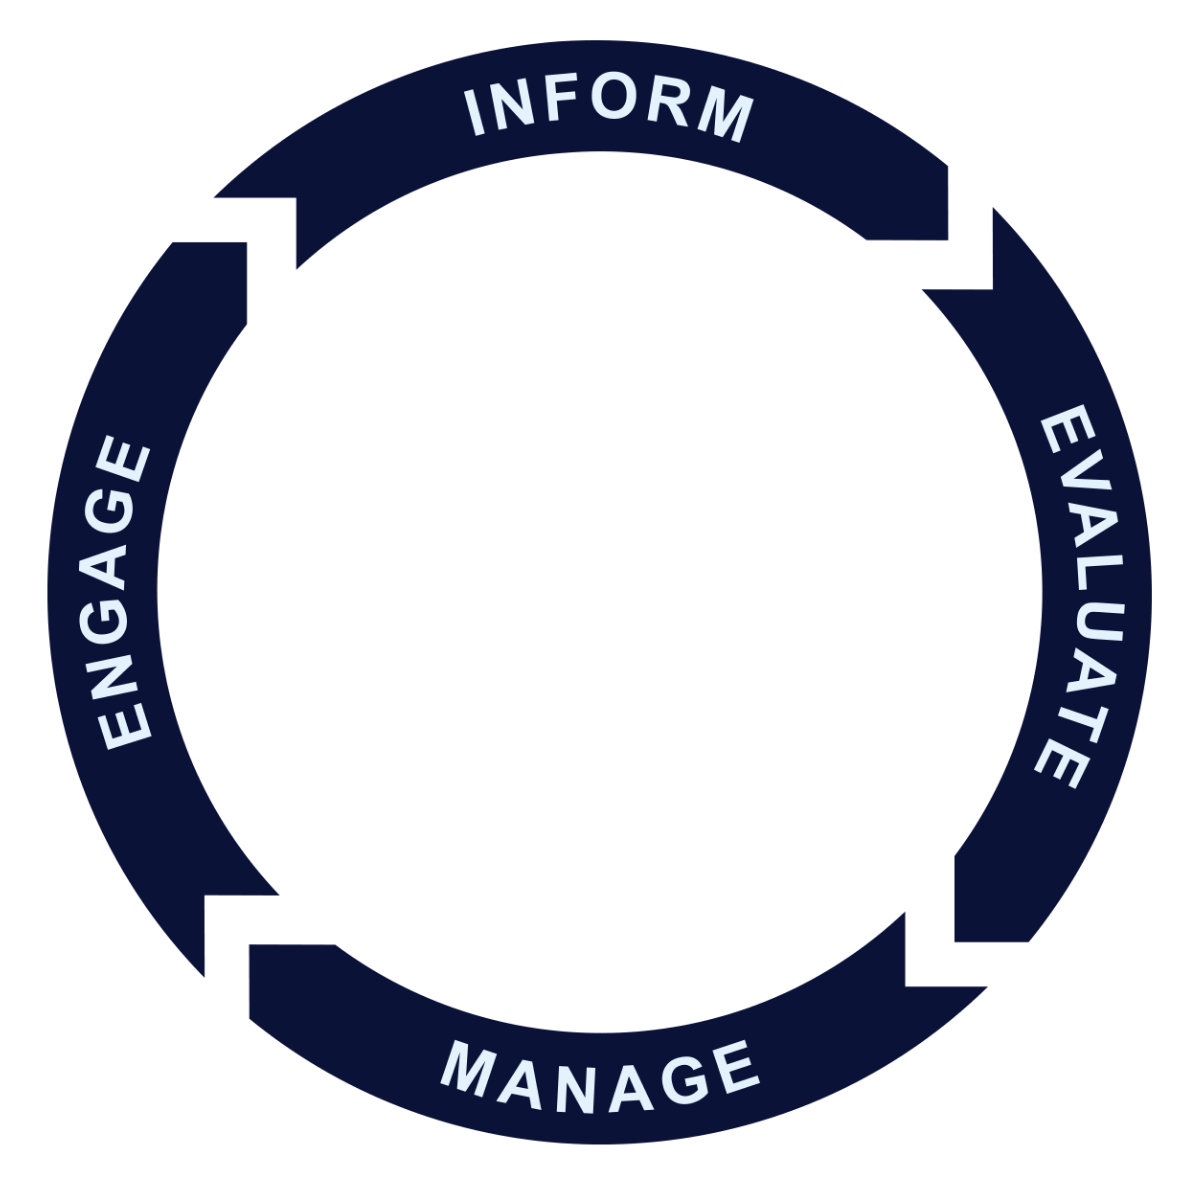
By evaluating Mission, Academics, Markets, and Margins in tandem, institutional leaders can move past subjective debates and make data-informed strategic decisions. This continuous cycle (Inform, Evaluate, Manage, and Engage) ensures your institution aligns program growth with workforce demand while safeguarding fiscal health and academic standards.




PILLAR 1:
Market Demand & Employer Alignment
Aligning academic offerings with real-world employer needs drives sustainable student recruitment and career placement.
Programs must prepare graduates for a rapidly evolving labor market. This pillar assesses external interest to ensure high placement rates and justify tuition investment.
Key metrics to track:
- Student Interest. Search volume and inquiry trends by region.
- Workforce Needs. Job posting growth and projected occupational demand.
- Graduate Outcomes. Average entry-level wages and skill alignment with target industries.
PILLAR 2:
Academic Performance & Student Success
Internal metrics reveal how effectively a program engages students, retains enrollment, and delivers academic value.
Academic quality is the bedrock of institutional reputation. Internal health indicators highlight high-performing offerings to scale and pinpoint programs needing curriculum refreshes.
Key metrics to track:
- Enrollment Health. Multi-year enrollment trends and course completion rates.
- Instructional Efficiency. Student-to-faculty ratios and credit hour production.
- Student Progression. Retention, persistence, and average time-to-degree.
PILLAR 3:
Competitive Intensity & Market Share
Understanding regional market share and competitor density prevents launching or maintaining oversaturated offerings.
No program exists in a vacuum. Mapping competitor density ensures your institution invests in high-opportunity niches rather than overcrowded spaces.
Key metrics to track:
- Competitor Density. Regional and online institution degree completions.
- Market Share. Your institution’s percentage of total regional completions.
- Differentiated Positioning. Identifying untapped demand vs. saturated program areas.
PILLAR 4:
Program Economics & Margin Analysis
True financial health accounts for direct instructional costs, net tuition revenue, and institutional contribution margins.
Sustainable academic portfolios require complete financial transparency. Rather than driving blind budget cuts, margin analysis empowers smart cross-subsidization.
Key metrics to track:
- Direct Revenue. Net tuition, course fees, and dedicated grants.
- Instructional Costs. Faculty compensation, specialized software, and lab overhead.
- Contribution Margin. Identifying high-margin surpluses to subsidize mission-critical programs.
Comparing Implementation Approaches
Not all evaluation methods yield the same results. Higher education institutions typically choose between three paths: attempting an in-house DIY process, hiring expensive external consultants, or adopting a repeatable software model.
Key comparison takeaways:
- Ad-Hoc / DIY: Slow and resource-heavy; relies on outdated static data that sparks campus political friction.
- Strategic Consulting: Provides temporary momentum, but lacks long-term software continuity after the engagement ends.
- Sustainable Path (Gray DI): Combines real-time market data with software repeatability to build a permanent, collaborative evaluation process.
| Evaluation Criteria | Approach 1: Ad-Hoc / DIY | Approach 2: Strategic Consulting | Approach 3: Sustainable Path (Gray DI) |
|---|---|---|---|
| Speed to Decision | Slow & Time-Consuming
| Multi-Year Effort
| Real-Time Strategy
|
| Internal Staff Burden | Severe Burnout
| Moderate Burden
| Low Staff Overhead
|
| Hidden Costs & Risks | High Political Friction
| Low Long-Term Adoption
| Sustainable ROI
|
| Data Recency & Depth | Outdated / Static
| Periodic Static Reports
| Live Market Analytics
|
| Scalability | Hard to Maintain
| Project-Based Only
| Ongoing Ecosystem
|
Sign Up for a Free Demo

Advance Your Leadership with APEM Certification
Higher education leaders face unprecedented pressure to balance mission, student demand, and fiscal health. Through a professional partnership between Bay Path University’s CHELIP and Gray DI, this online, self-paced credential provides administrators with the actionable frameworks needed to make transparent, data-informed program decisions.