
As discussed in the previous blog, you can use a PES to identify competitors located in your core geographic market. You can see how many institutions report completions, by sector and award level. You can also use IPEDS and other institutional data included in a PES to sort and filter on price, selectivity, enrollment, demographics, growth trends, and more to identify competitors most relevant to your institution.
In this blog, we will discuss how to use a PES to identify schools you may be competing against but don’t even know about. We’ll call them “hidden” competitors.
You Need More Than IPEDS Data
IPEDS completions data provides the basis for identifying and benchmarking competitors in your core market. But what about potential competitors located outside of your core market? IPEDS data alone does not tell the whole story, and this is especially true for online competition.
IPEDS reports completions to the headquarters location of an institution, meaning IPEDS reports several hundred thousand online completions in the headquarters location of the institution, not where online students live and study. For example (see illustrative graphic below), approximately thirty-thousand University of Phoenix completions are reported in Phoenix, AZ, but most of these students reside in other states, including yours.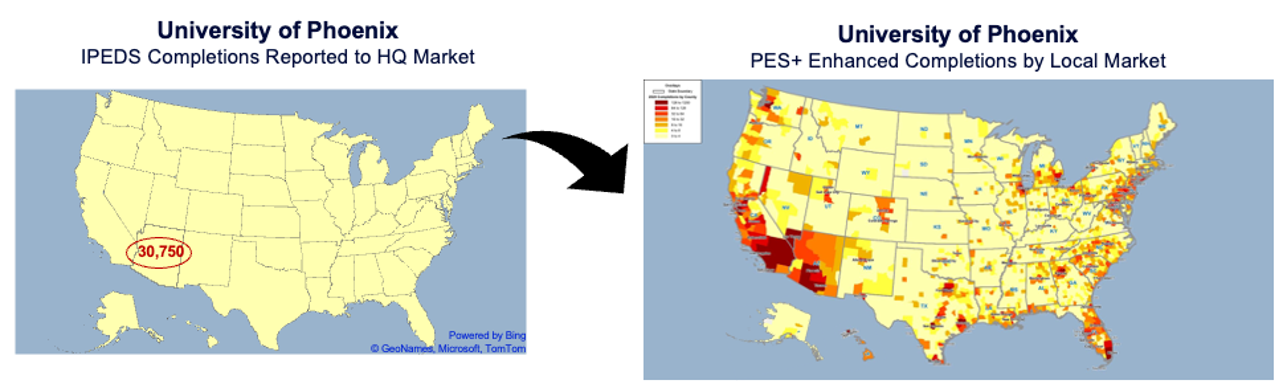 Source: Gray DI analysis of data from IPEDS, NC-Sara, and proprietary data streams
This grossly overestimates the number of graduates in Phoenix, suggesting a market saturation that may not actually exist. It also skews data used for labor market analytics. Employers looking for graduates with specific degrees and skills in Phoenix will see a large number of graduates in the market that really live somewhere else.
Conversely, in other geographic markets, IPEDS completions data misses thousands of online students and graduates, potentially underestimating demand for academic programs and the number of qualified graduates in the local labor force.
It also provides an incomplete view of competition. Many online colleges and universities will not appear as competitors in your core market, when in actuality they have a presence and are drawing students away from local institutions. As online education continues to grow, this distortion will increase.
Tracking “Hidden” Online Competitors
A good Program Evaluation System (PES) will help you identify and track online competitors with a presence in your market. Gray’s PES puts online completions back in the local neighborhoods where the students live, using online enrollment and completions data by institution and program and proprietary analytics. Our PES helps you identify “hidden” competitors not visible using IPEDS data alone. It shows you how many students in your core market are completing programs online at institutions located outside of your core market and which institutions are taking share. This type of data will allow you to focus marketing and recruiting efforts to win these students back to local institutions.
(As noted in the previous blog, when working with institutions, Gray conducts distance analyses to create core market definitions based on census tracts, which are twice as precise as zip codes. For the purposes of this blog, however, we will use the state of Texas as our sample market.)
Using data from Gray’s PES, we can evaluate the breadth of online competition in the Texas market. We do this by tracking completions based on student location and institution location. The metric we use, online completions by in-market students, provides an estimate of the number of students in a given market (in this case Texas) that complete programs online, including those that complete programs at Texas-based institutions and those that complete programs at schools headquartered outside of the market.
In the chart below, the left side shows a total of almost 429k completions by Texas students. By our estimates, 18 percent of these programs were completed online. The right side of the chart shows that 47 percent of online students in Texas completed their programs at out-of state institutions.
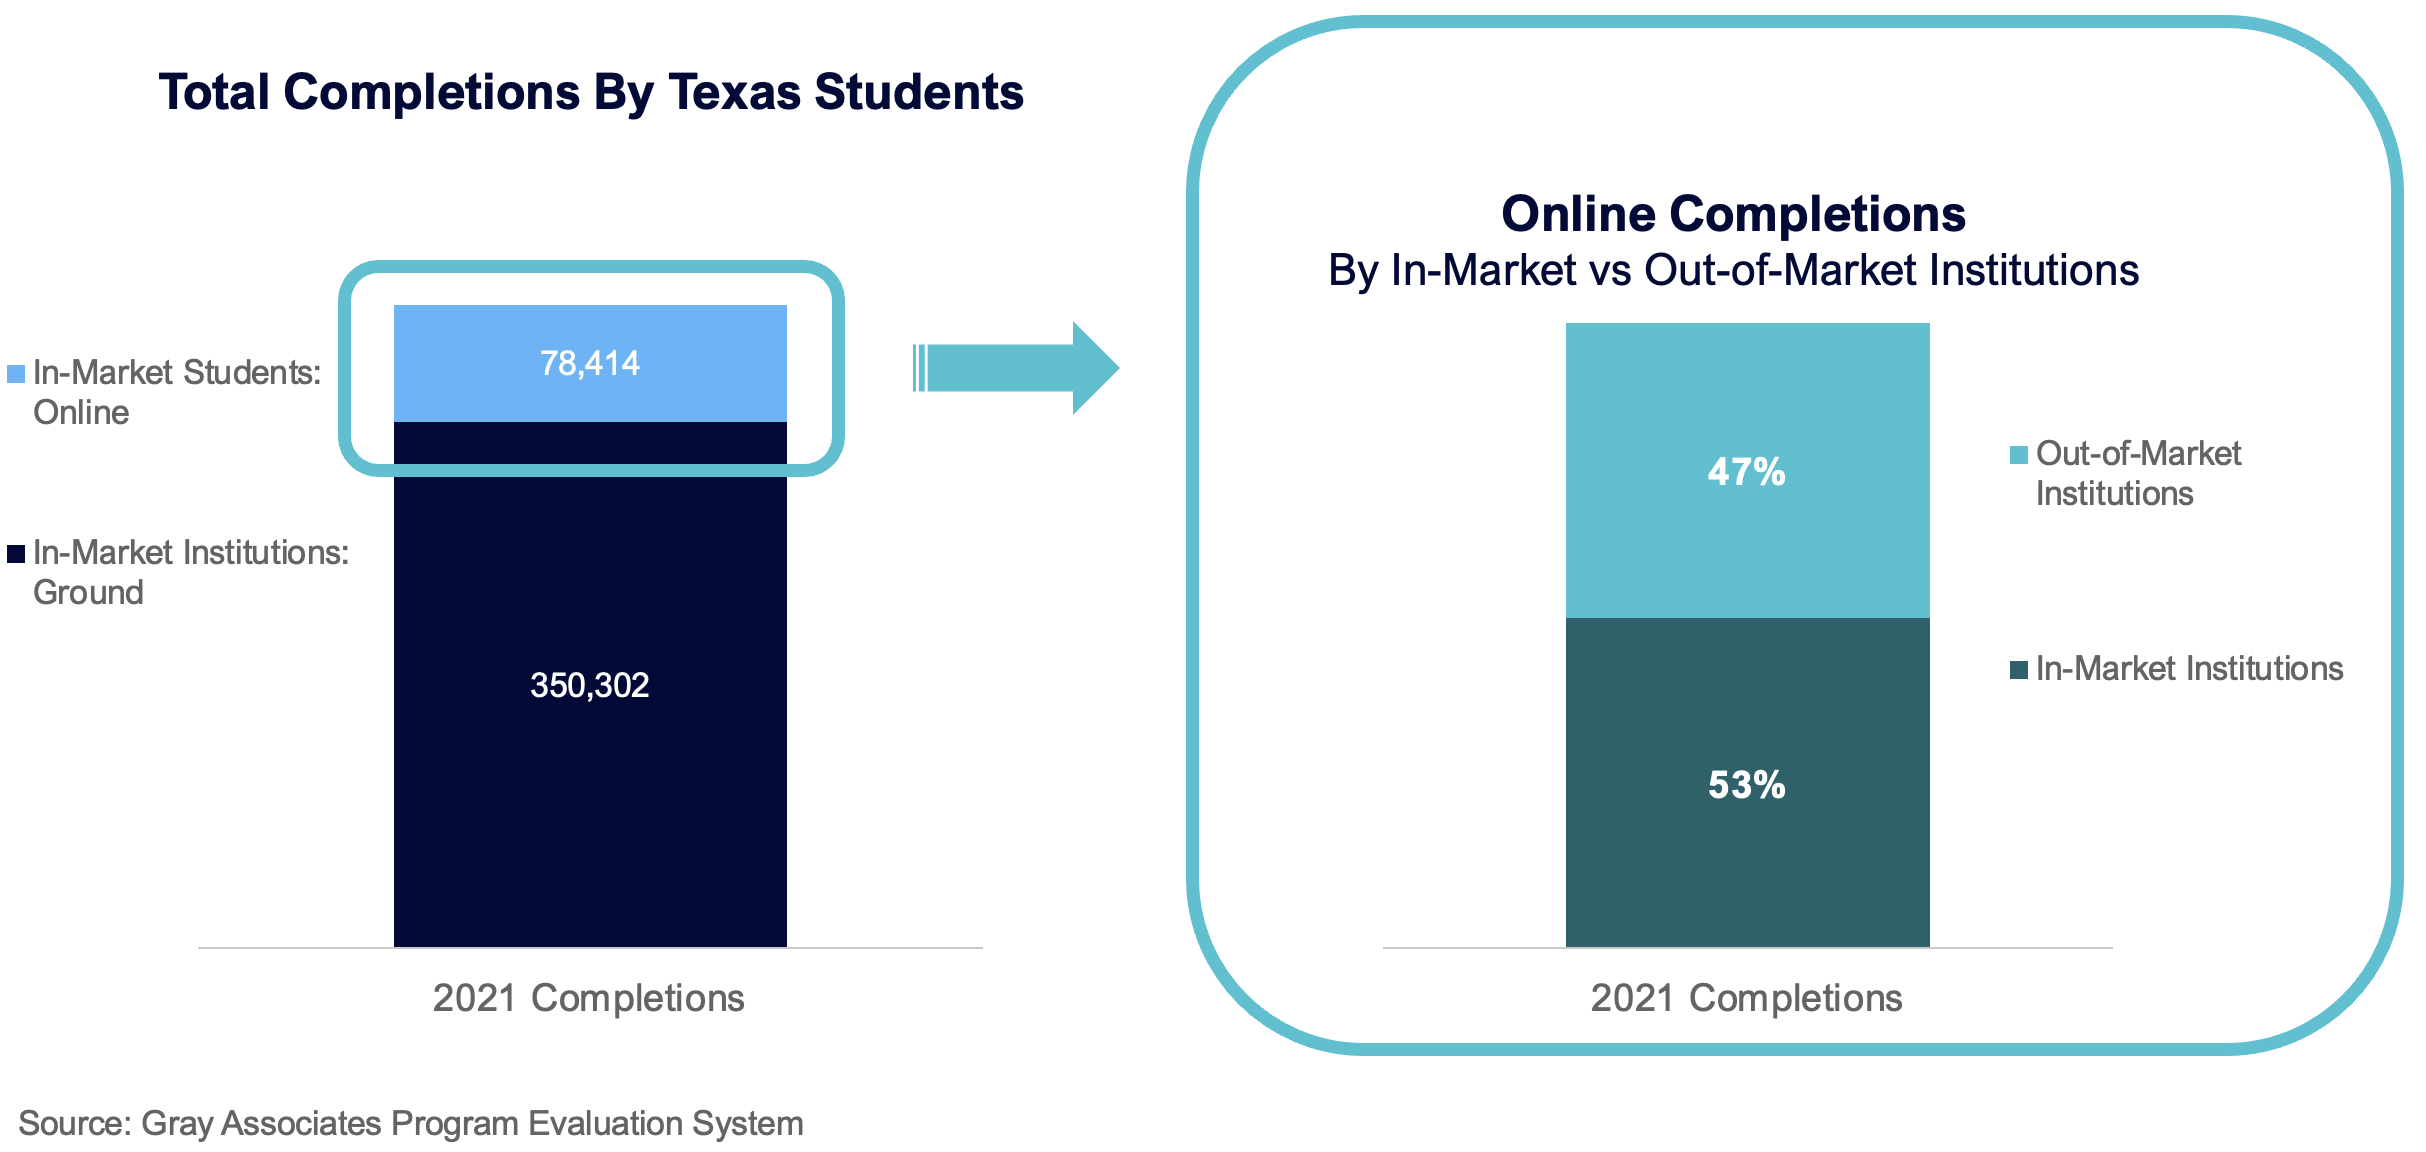
In essence, Texas institutions are competing not only against each other, but also against out-of-market institutions who are enrolling and graduating students online.
So who exactly are these “hidden” online competitors? Let’s take a look.
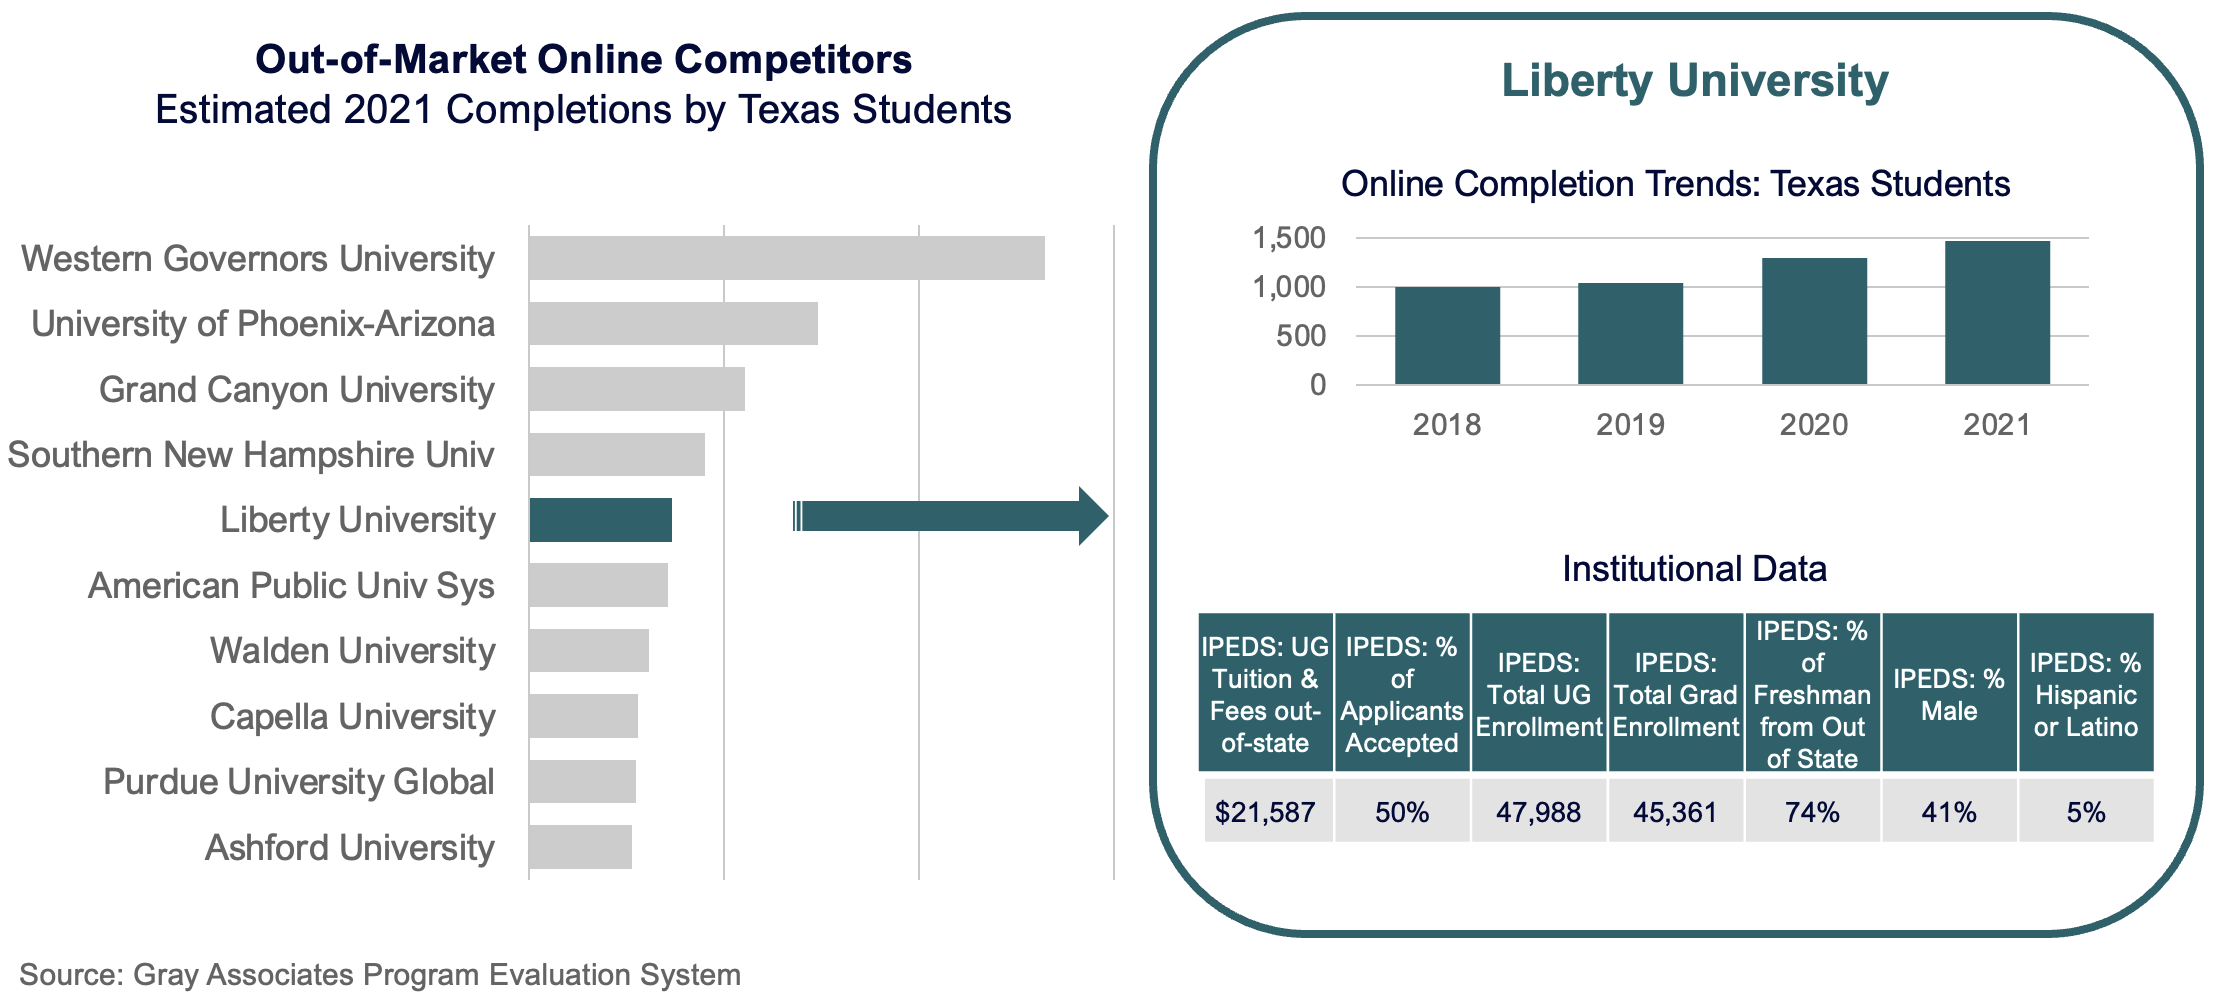
Using the data from the previous analysis, we can filter the out-of-state institutions by total completions volumes for online Texas students. The list of the top out-of-state competitors in the Texas market is shown on the left side of the image below below. If you want to examine a competitor in more detail, you can pull benchmarking data from the PES as discussed in the previous blog and illustrated in the right side of the image below.
Other “Hidden Competitors”
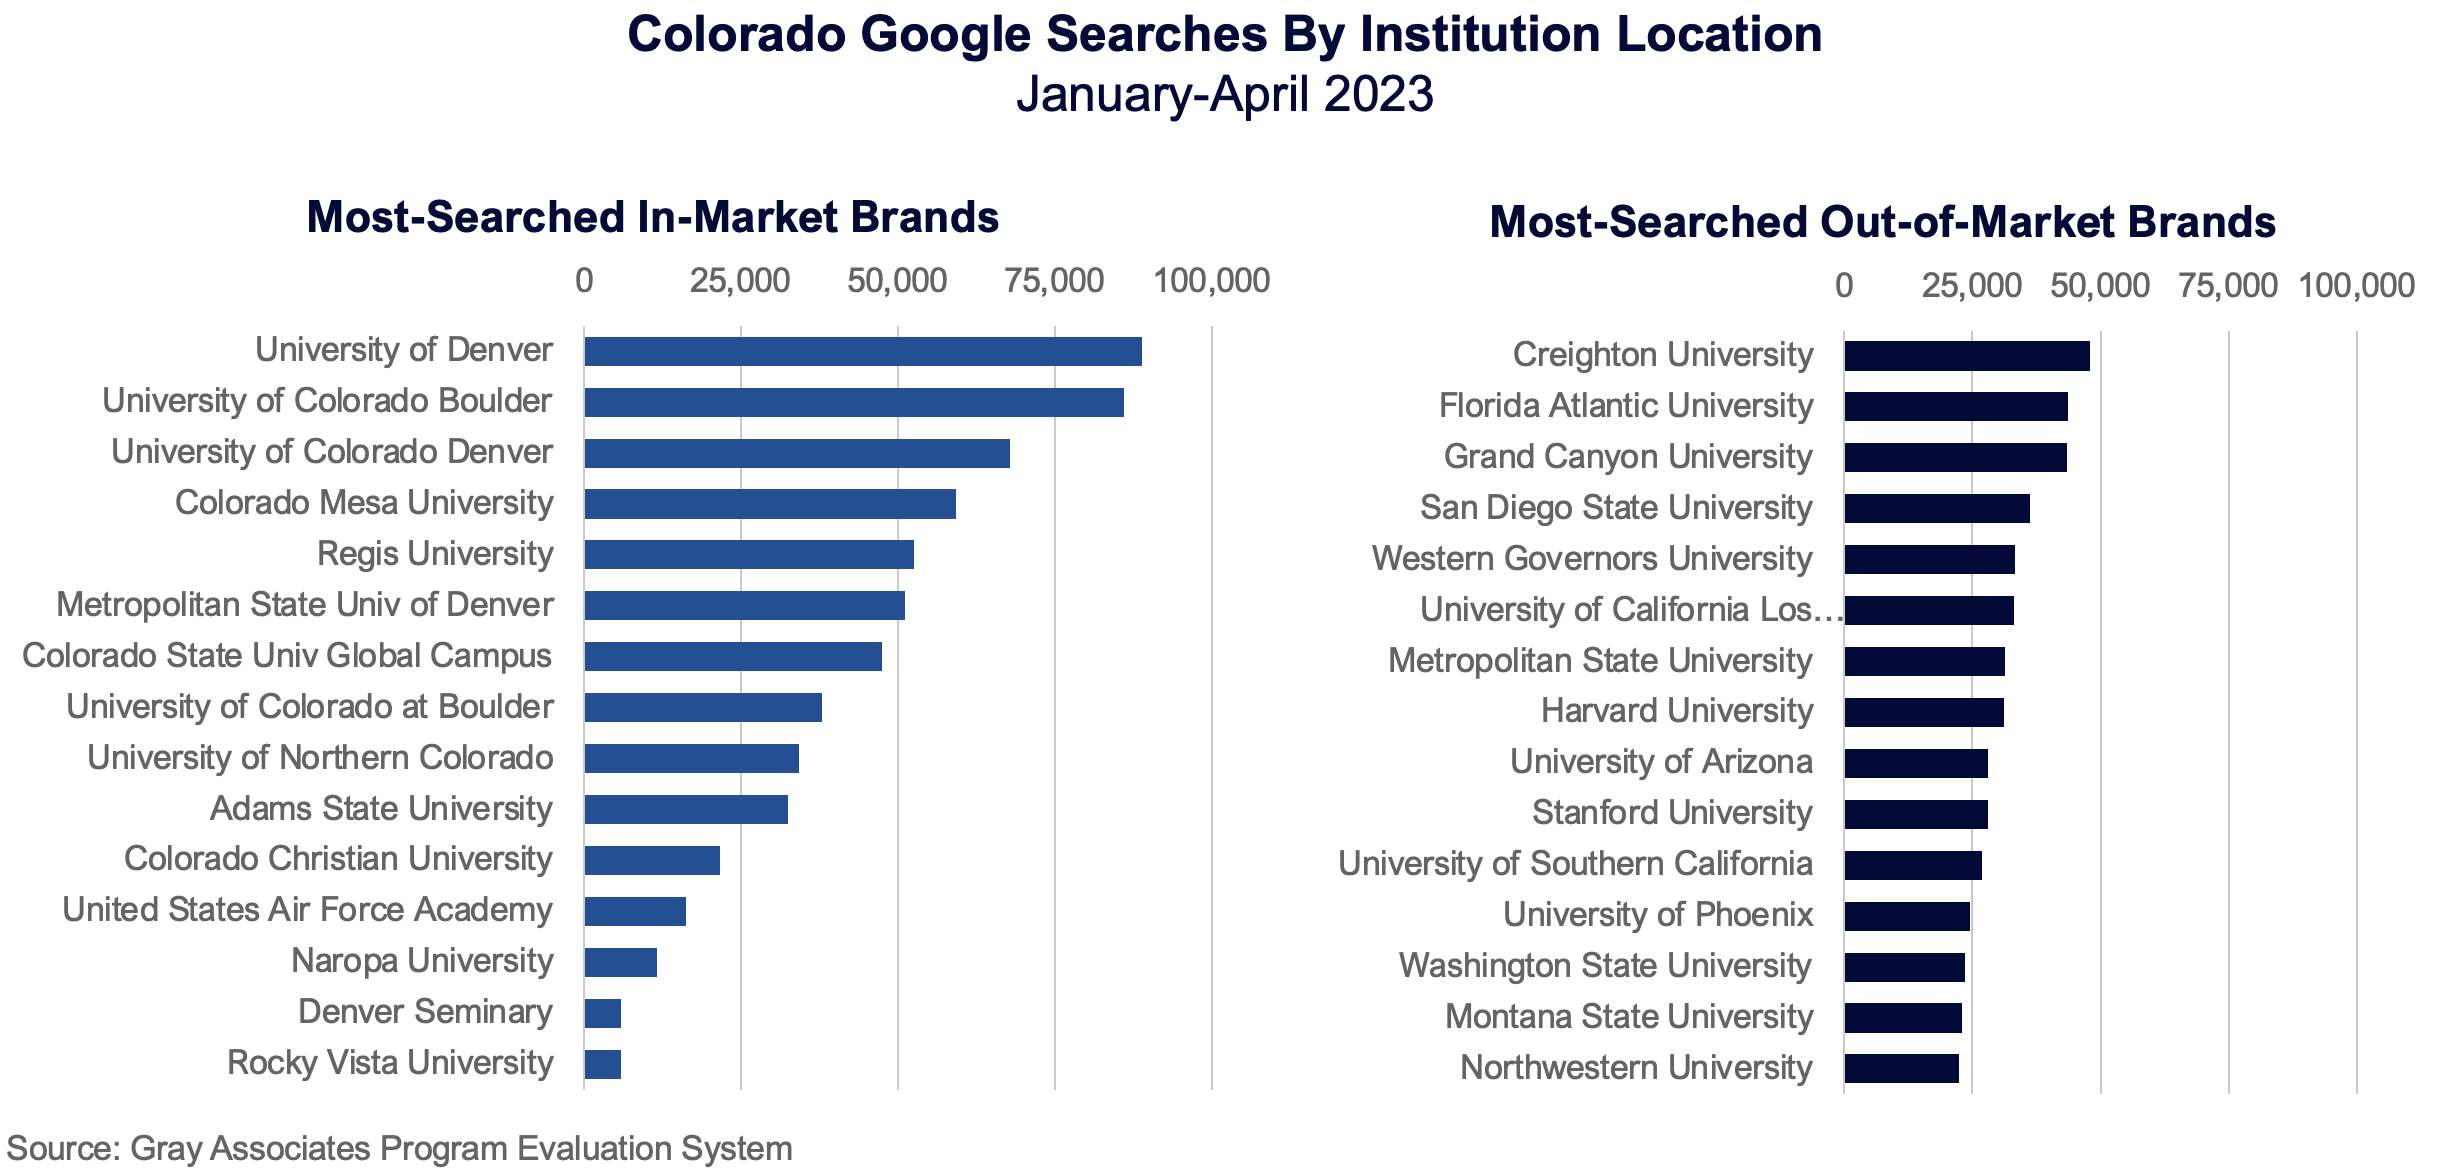
Another way to identify “hidden” competitors is to pull data on institutional brand searches. In the previous blog, we pulled brand search data from Gray’s PES for competitors located in the core market. But students in your market are exploring schools outside of your market as well. If we expand the brand search data to include searches for all institutions – not just those in the core market – we can see what other schools are on students’ radars.
In the example below, we pulled Google search volumes for searches originating in Colorado. The bar chart on the left shows the top in-market schools by search volumes. The chart on the right shows which other competitors outside of the core market have brand awareness there.
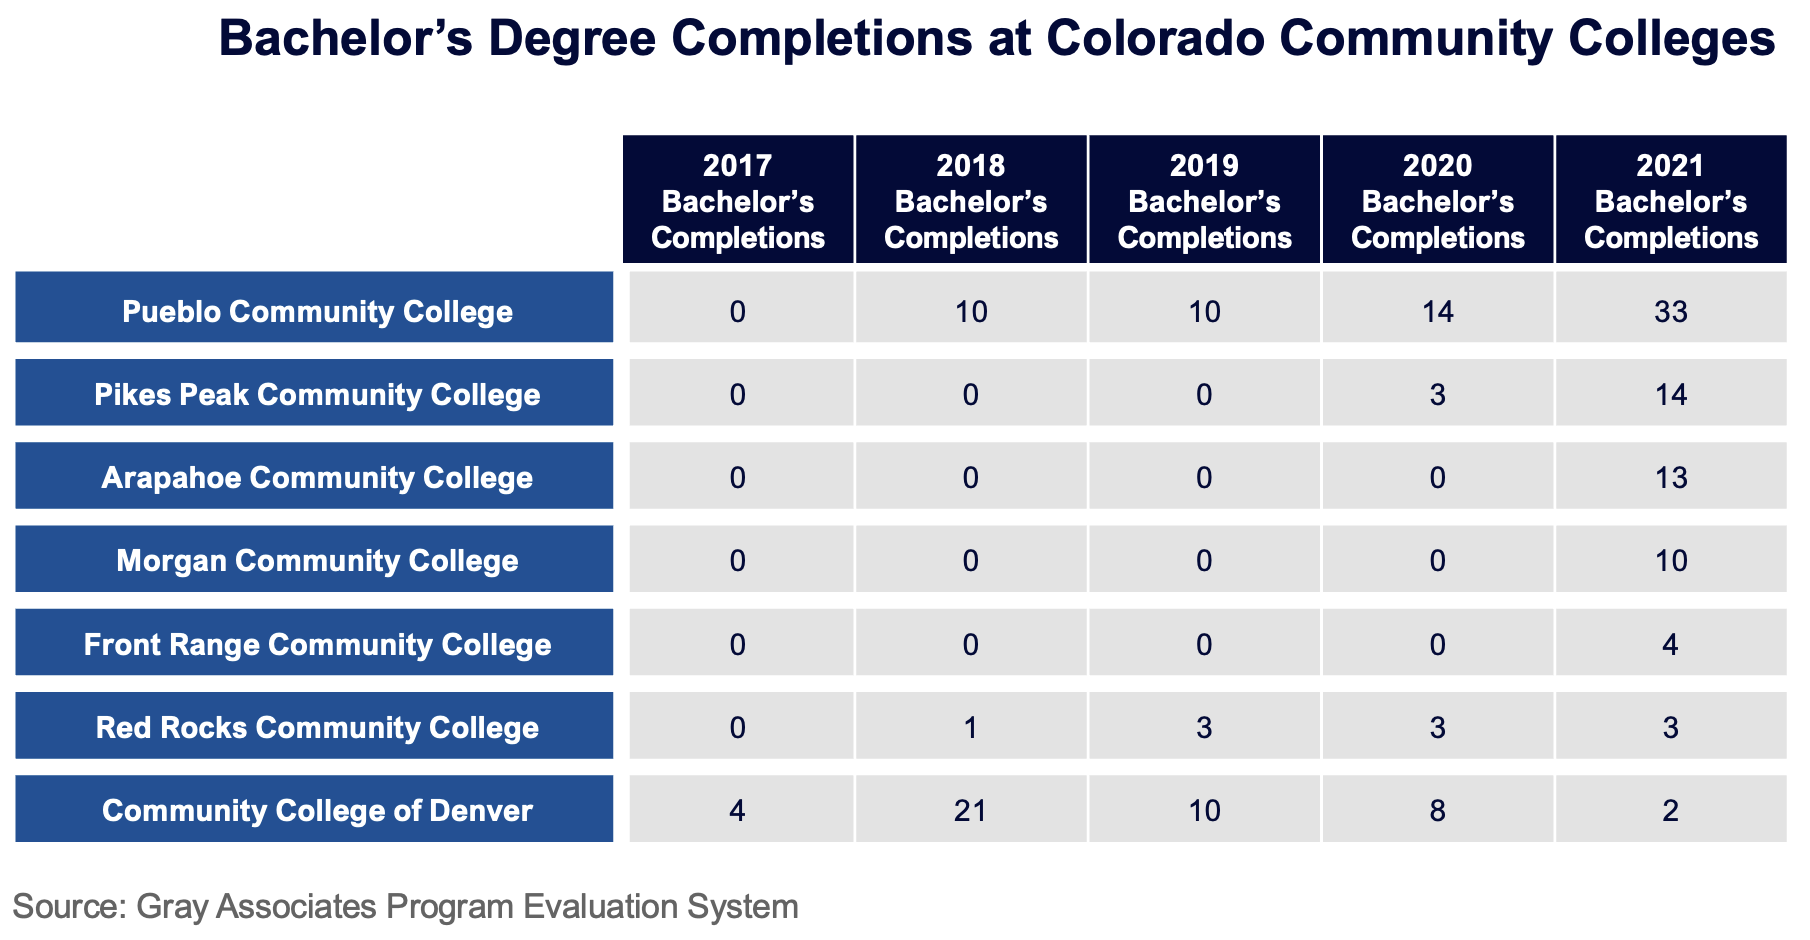
Recent legislative and regulatory actions at the state level are bringing new competition for certain program award levels. For example, in some states, community colleges now offer bachelor’s degree programs. For many four-year colleges and universities, community colleges represent a pipeline of potential transfer students. But now, they may also represent another competitor right in your backyard.
You can use a PES to see which, if any, community colleges in your market are graduating bachelor’s degree students. The example below shows the growth, albeit small, of bachelor’s degree completions reported by Colorado community colleges. As you can see, the first completions were reported in 2017, with four completions at the Community College of Denver. By 2021, seven community colleges reported a total of 79 bachelor’s completions.
A Few Additional Data Sources to Consider
A few other good sources of competitive data include the National Student Clearinghouse and IPEDS peers. You can consider adding these data sets to your PES to provide additional insights on prospective competitors.
Student Tracker data from the National Student Clearinghouse lets you see which other schools your applicants applied to and their intended majors. You can track this data over time to stay on top of competitive trends.
IPEDS provides institutions with benchmark data on their self-identified peer sets. A new tool provided by The Chronicle of Higher Education lets you see which colleges and universities are in your own peer set, and which ones consider your institution as one of their peers.
Up Next
The first two blogs in this series discussed how to use a PES to identify and track competitors at the institution level, including those in your core market and “hidden” competitors that may not have been on your radar. In the next installment, we will show you how to use a PES to analyze competition at the program level. Depending on your mix of programs and award levels, your competitive set for each may vary. Understanding program-level competition can help focus and refine your program marketing and recruiting efforts to drive enrollment growth.