
One thing I’ve learned working in higher education is that it is critical to map out an effective and efficient process for data-informed academic program evaluations and decisions.
In my last blog post, Using Market Data to Inform Academic Program Decisions, I shared the steps we took to analyze market data:
- Define your relevant market
- Prioritize the market factors
- Compile the market data
With these steps completed, an institution could rely on this market data to inform which programs to start, stop, and grow. The example below shows how to apply the market analysis that leads to a successful new program proposal.
Approach: Academic Program Proposal
Imagine you already have a successful on-campus program at the bachelor’s level. Your proposal is to offer a new program at the master’s level, but changing to an online modality. The program will give students what they need to prepare them to meet the evolving needs of the job market.
Gathering Academic Program Data in a Scorecard
The first step in your market analysis is to identify the Classification of Instructional Programs (CIP) Code. We can then use that CIP code to review data in multiple areas, including student demand, employment, competition, and degree fit. Gathering this data on your own can be time-consuming and inefficient. The example below uses PES+ to automatically generate a scorecard to review the data and determine if this program would be a good fit.
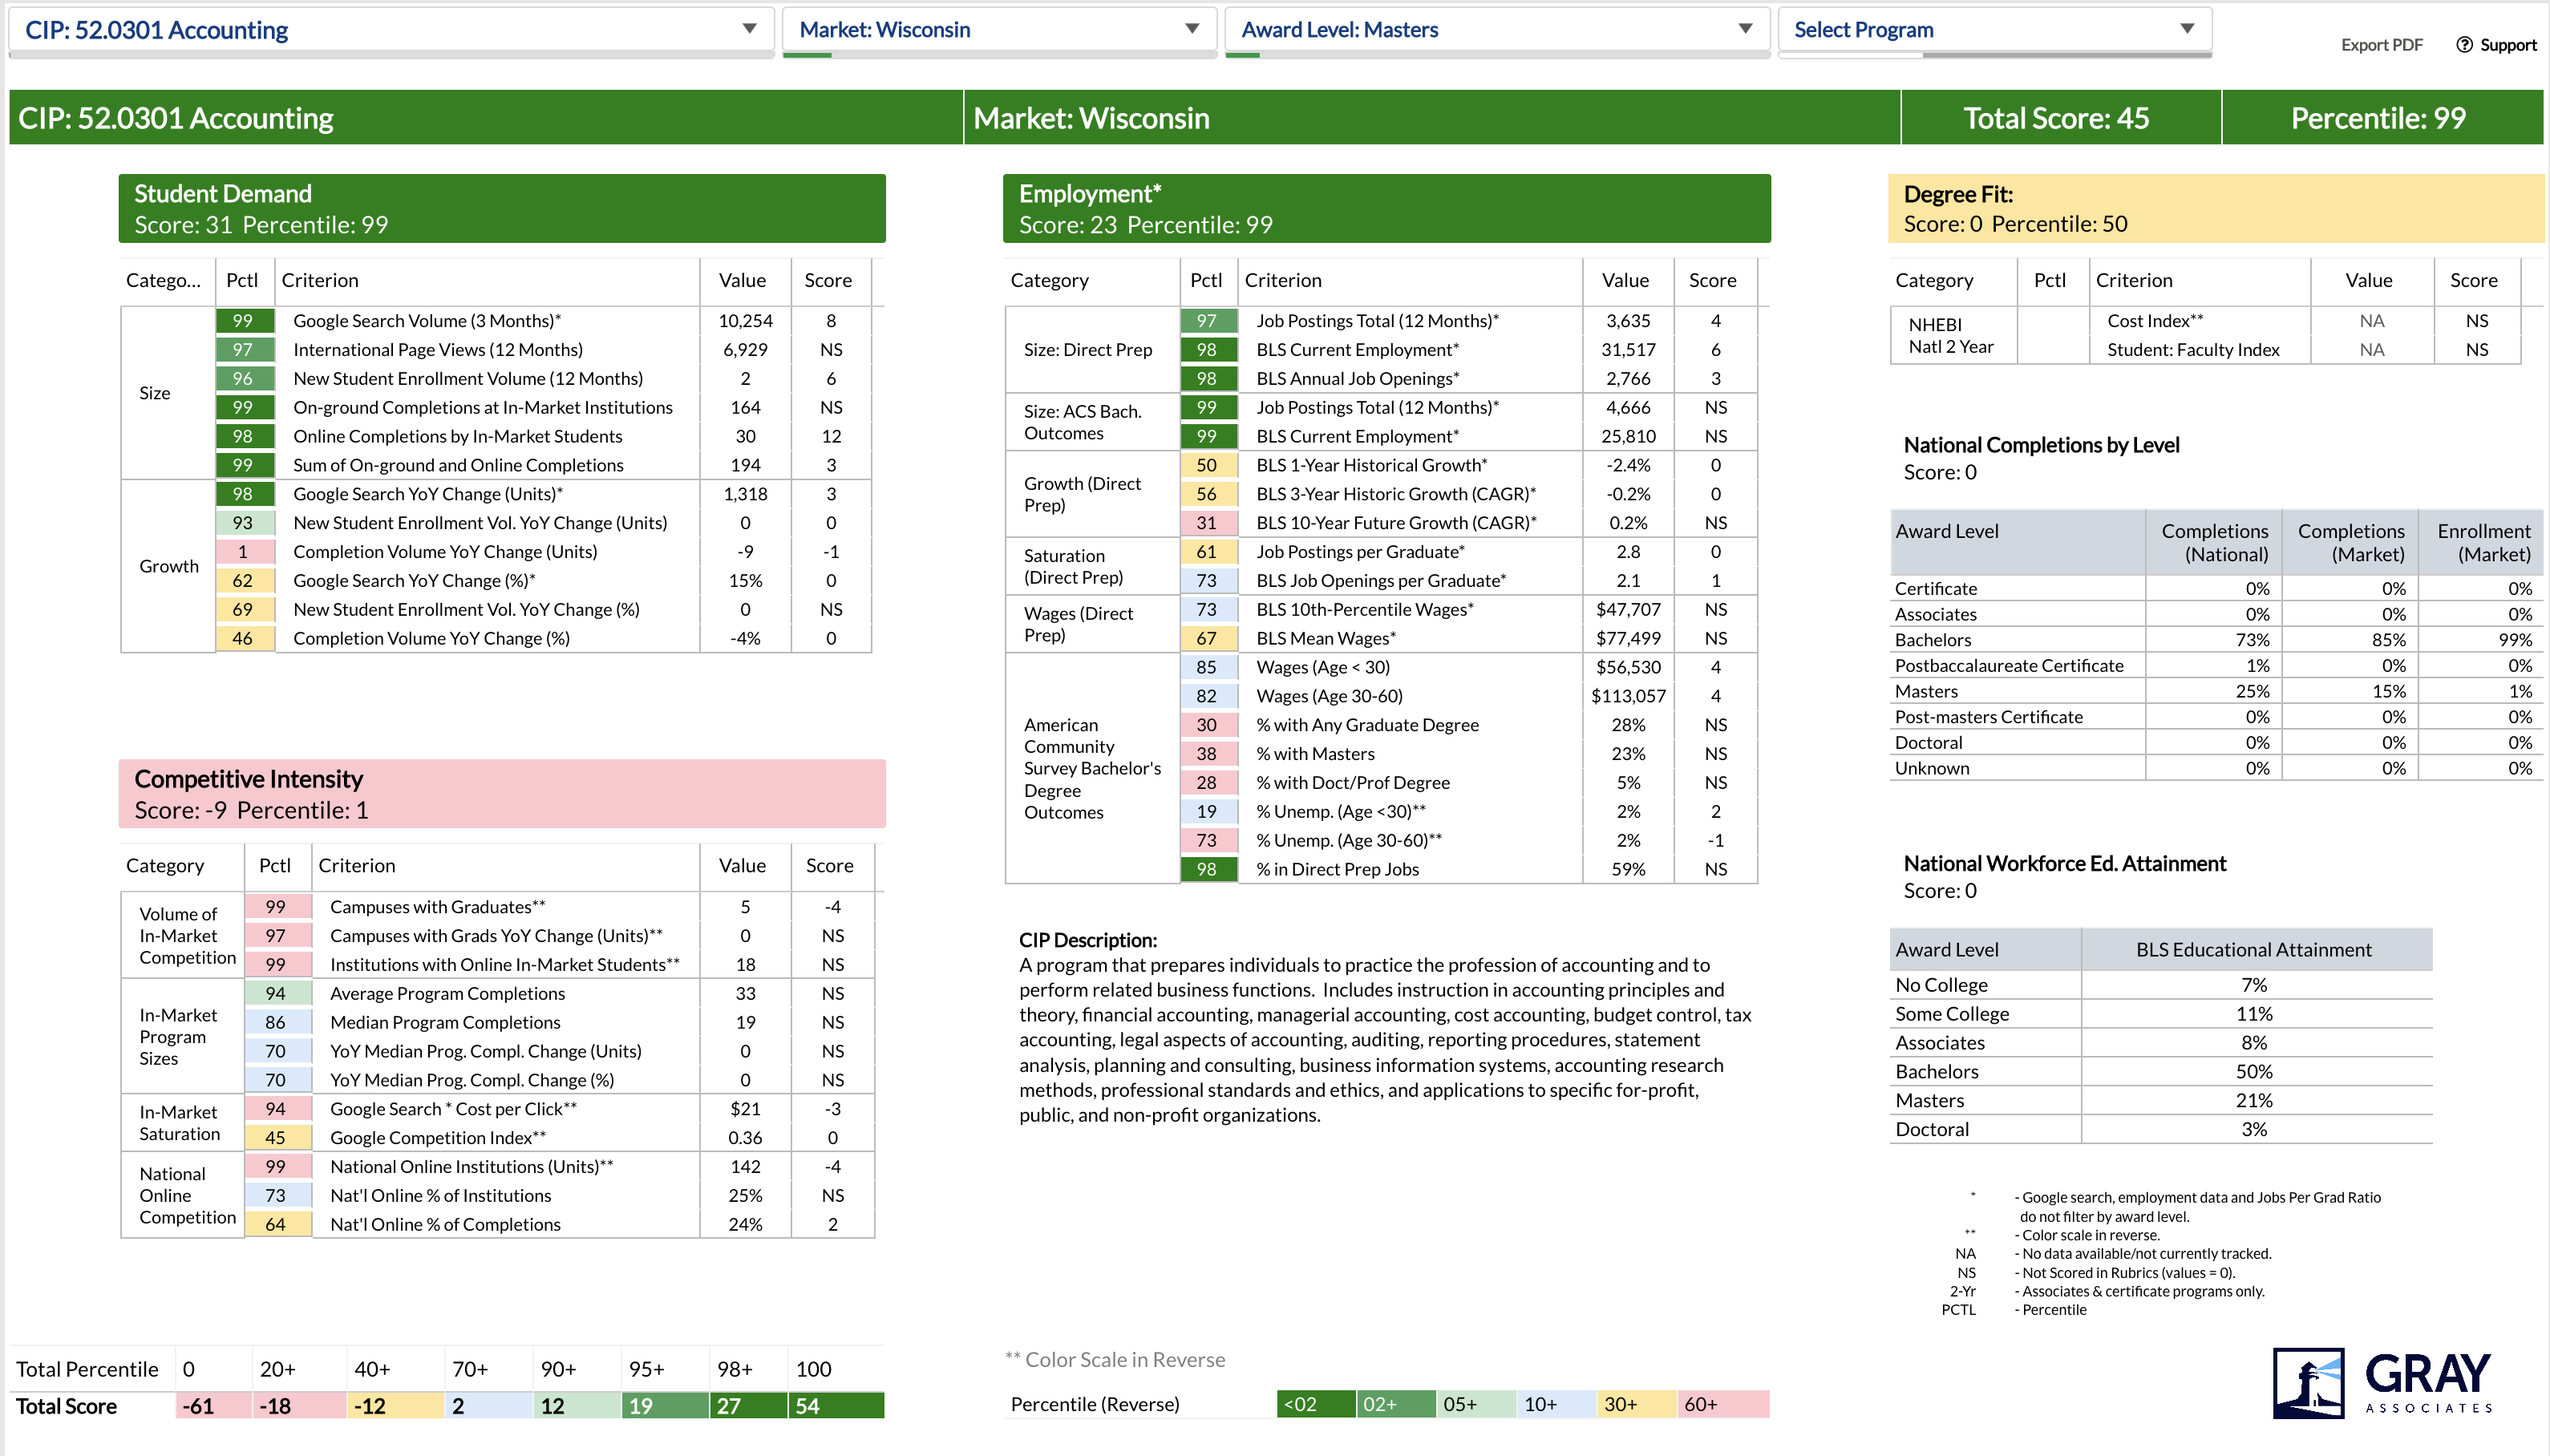
The example below shows the market analysis of an online Accountancy program at the master’s level.
Identifying the Academic Program Market
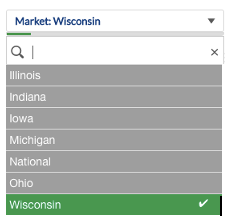
Below is the drop-down list under Market on the PES+ scorecard. For the most accuracy, you should narrow down the data to reflect the institution’s specific geographical markets. When looking at an online program, it is also beneficial to look at the national market.
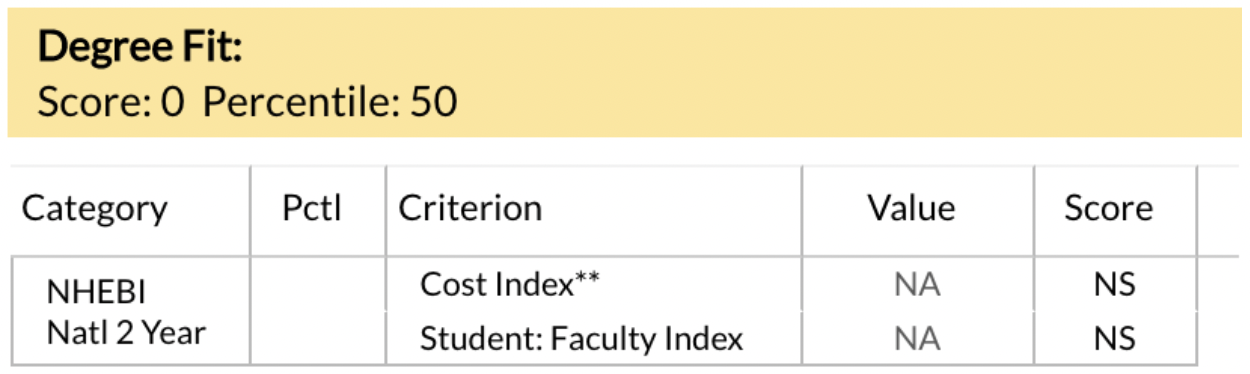
Does the Degree Level Fit?
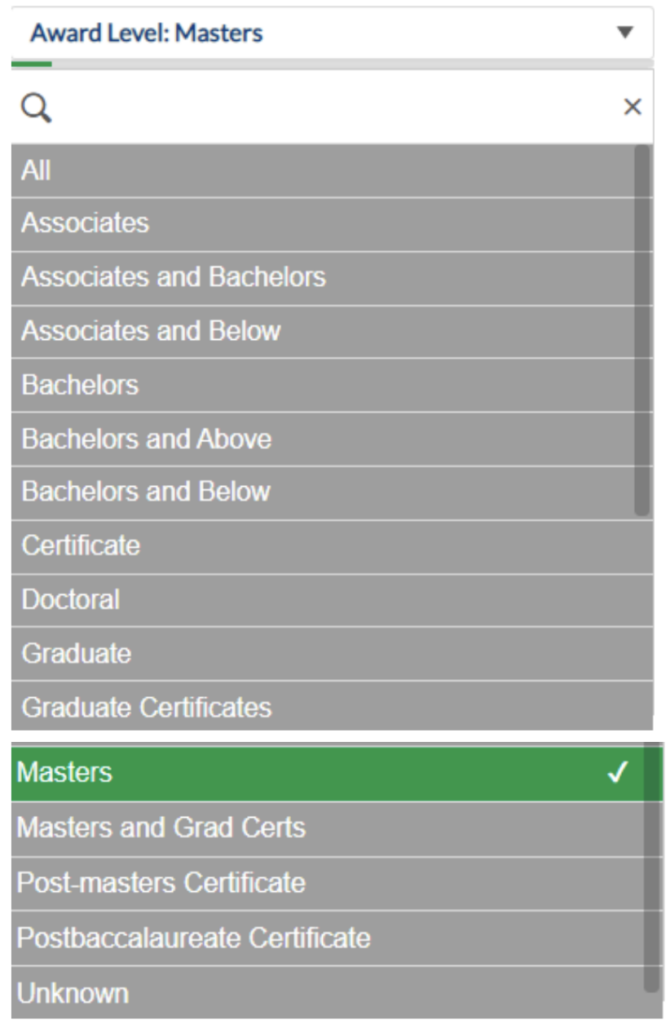
To offer this program at the master’s level, check the score for the award level to make sure there is enough data to support this decision.
Student Demand Data
The table below lists metrics from multiple sources. Scores and percentiles are assigned based on the values of these metrics. The percentiles are color-coded for straightforward interpretation.
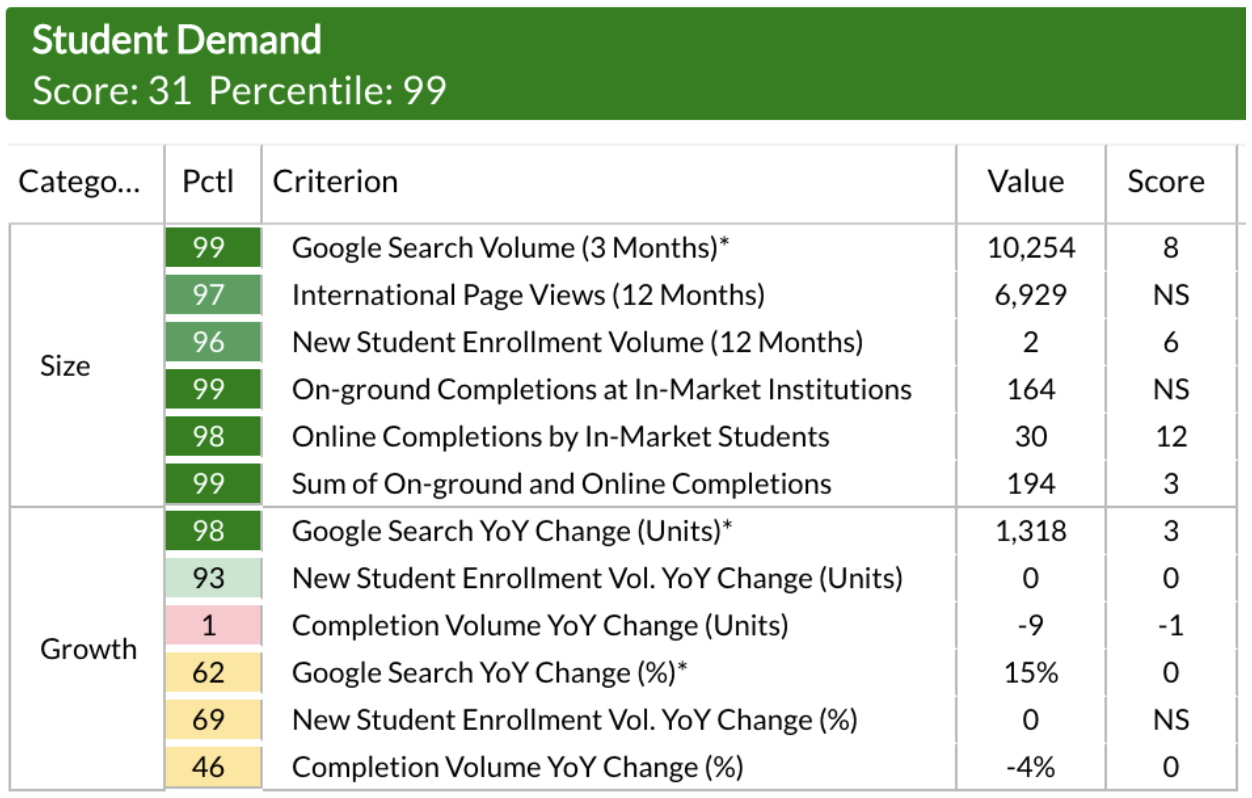
In 2020 (the most recent year of market data), there are 30 online completions of this program within this award level and market. Based on this value, the software provides a score of 12 for this metric. This falls within the upper 98th percentile, meaning it scores higher than 98 percent of all programs within this award level and market.
The growth side for student demand is less optimistic. For example, there are nine fewer completions in 2020 than in 2019. Part or all of this decline might be related to COVID.
The table heading’s green indicates favorable market data. All the metric scores total 31. This puts it in the upper 99th percentile overall, showing that student demand for a master’s level Accountancy program within the Wisconsin market is robust.
Competitive Intensity Data
The data below shows that this is a very competitive market. For example, there are five other campuses with Master’s in Accountancy graduates within this market. Doing a deeper dive into competitor data reveals trends in completions over recent years and market share. This market is saturated, as evidenced by the $21 Google search cost-per-click; this indicates that relative to other programs, it is expensive to advertise in this market.
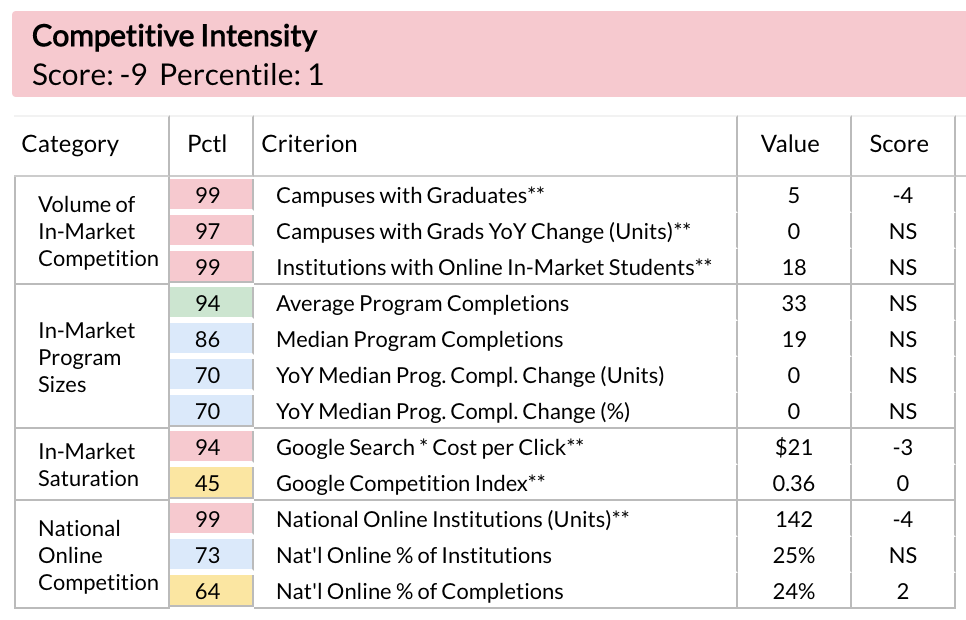
The table’s heading is pink, indicating unfavorable market data. All of the metric scores total -9, ranking competitive intensity in the highest 1st percentile.
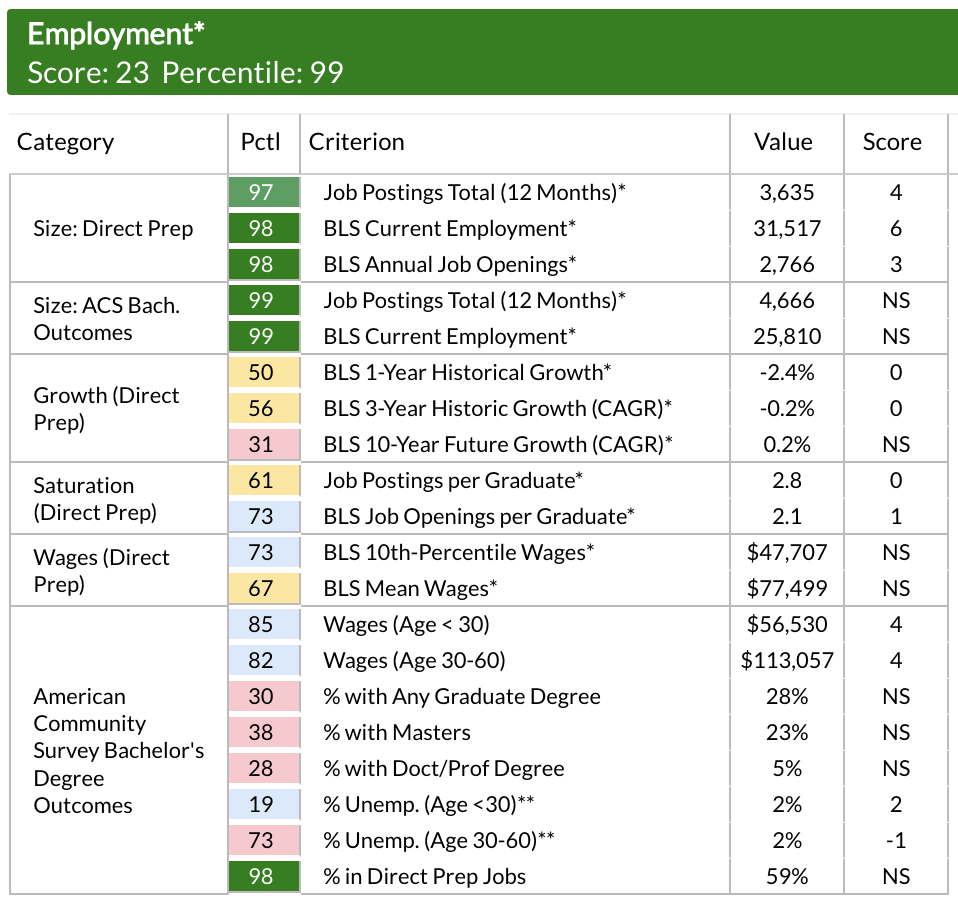
Employment Data
There are a lot of job opportunities available within this market for graduates with a Master’s degree in Accountancy. These metrics are in the upper 97th to 99th percentiles, and drive a high Employment score. The wages are higher in comparison with other programs.
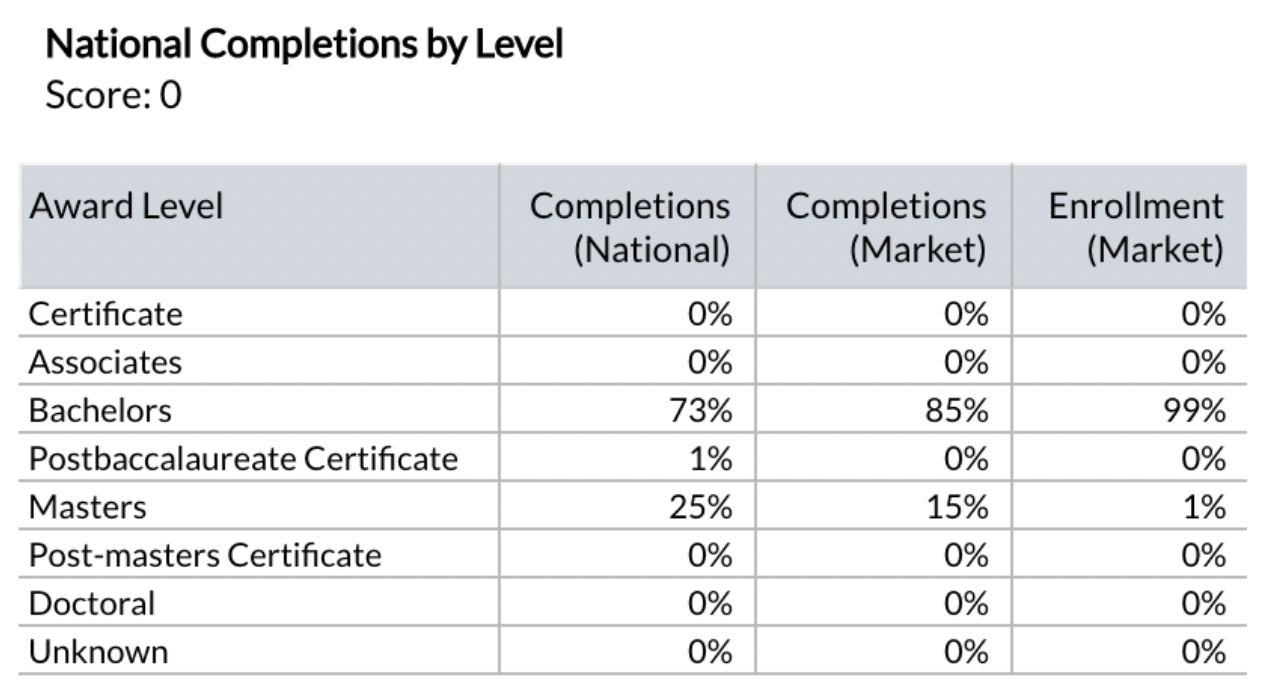
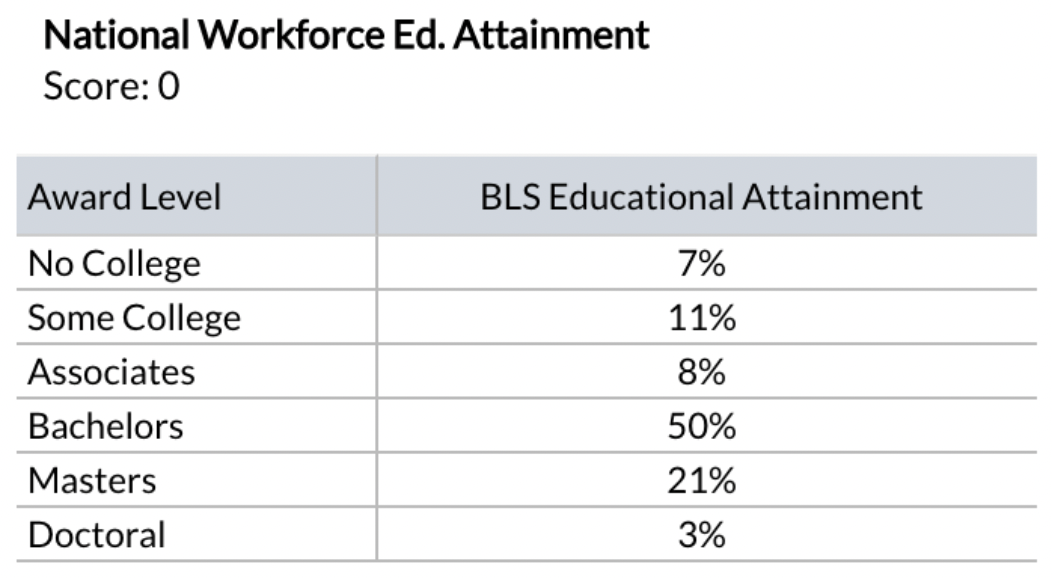
Degree Fit Data
This program could be offered at either the bachelor’s or master’s award level. The National Completions by Level table below confirms this. The Degree Fit score is zero (0). In the Degree Fit category, positive scores do not exist; a negative score would indicate that a higher or lower degree level would be more appropriate for the program.
Accountancy Program Overall Score

The market scorecard’s overall score of 45 is the sum of the scores described above in Student Demand (31), Competitive Intensity (-9), Employment (23), and Degree Fit (0). Student demand is a major factor driving the market attractiveness of this program. Therefore, it outweighs the competitive intensity.
Analyzing market data informs academic program evaluation and decision-making, leading to a strong program portfolio.
Start, Stop, or Grow? A Data-Informed Approach to Academic Program Evaluation and Management can be purchased through Amazon.