
As March Madness continues, drawing in sports fans from across the country, a question pops up: Does the money spent by NCAA Division I men’s basketball programs affect their chances of making it to the tournament? Let’s dig into how financial investment and success intersect in college basketball.
In the high-stakes world of NCAA men’s basketball, the correlation between a team’s annual expenses and their likelihood of dancing in March is starkly illustrated by the latest data. The more a team spent, the better their chances of earning a tournament bid, and a table detailing the odds of men’s basketball teams making it into this year’s NCAA Tournament based on their spending for the 2022-23 academic year reveals a clear upward trend.
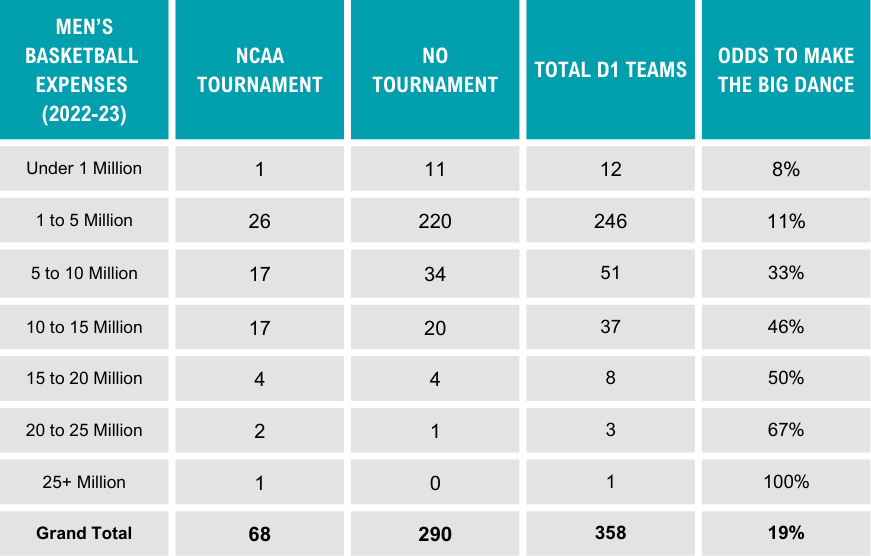
Source: Gray DI’s PES Athletics Benchmarking and analysis of EADA data
The numbers are telling: Teams with expenditures under $1 million have a mere 8 percent chance of joining the fray. As we climb the fiscal ladder, teams shelling out between $1 to $5 million see only a slight uptick in their odds, sitting at 11 percent.
The leap becomes pronounced in the $5 to $10 million range, with these teams tripling their chances to 33 percent. The upward trajectory continues as teams spending $10 to $15 million boast nearly a coin flip’s chance at 46 percent. And those with the resources to allocate $15 to $20 million reach an even 50 percent chance of participation.
The tipping point comes for those teams investing $20 to $25 million, where two-thirds are expected to make the tournament. The pièce de résistance? A 100 percent tournament participation rate for teams that invest over $25 million into their program annually.
While the odds of making it into the tournament this year sit at 19 percent, the data speaks volumes about the competitive world of college basketball. This raises important questions about how financial resources impact a team’s success through improved facilities, coaching, recruitment, and training.
This data-informed insight is a game-changer for athletic directors, coaches, and policymakers at the intersection of sports and education economics. It raises the question: How can institutions level the playing field, or is the court tilted indefinitely towards those with deeper pockets?
As March Madness begins, these numbers will fuel conversations across campuses and amongst fans as they ponder the true cost of victory and the value of investment in sports programs.
To learn more about Gray DI’s PES Athletics Benchmarking and how it can help to optimize your athletic programs for strategic decisions, click here.