To attract new students to your programs, you need to understand the unique competitive landscape for each one.
Colleges and universities compete with one another on two levels – at the institution level and the program level. Some students choose a school first and then decide on a major or program. Others choose a school based on the academic program they want to study.
The first two blogs in this series discussed using a Program Evaluation System (PES) to analyze competition at the institution level. This installment will focus on how to use a PES to analyze competition at the program level.
A Brief Lesson in CIP Codes
Let’s start with the basics – what is a program? It is a single academic program at a specific award level.
IPEDS’ Classification of Instructional Programs (CIP) code taxonomy provides a hierarchical structure for classifying academic programs, making it easier to track, analyze, and compare data across different programs and institutions.
Using this taxonomy, colleges and universities assign each program a 6-digit CIP code. The first two digits of the CIP code indicate the broad discipline, the first four digits indicate the discipline and general field of study, and the full 6-digit CIP code denotes the specific focus area of the academic program.
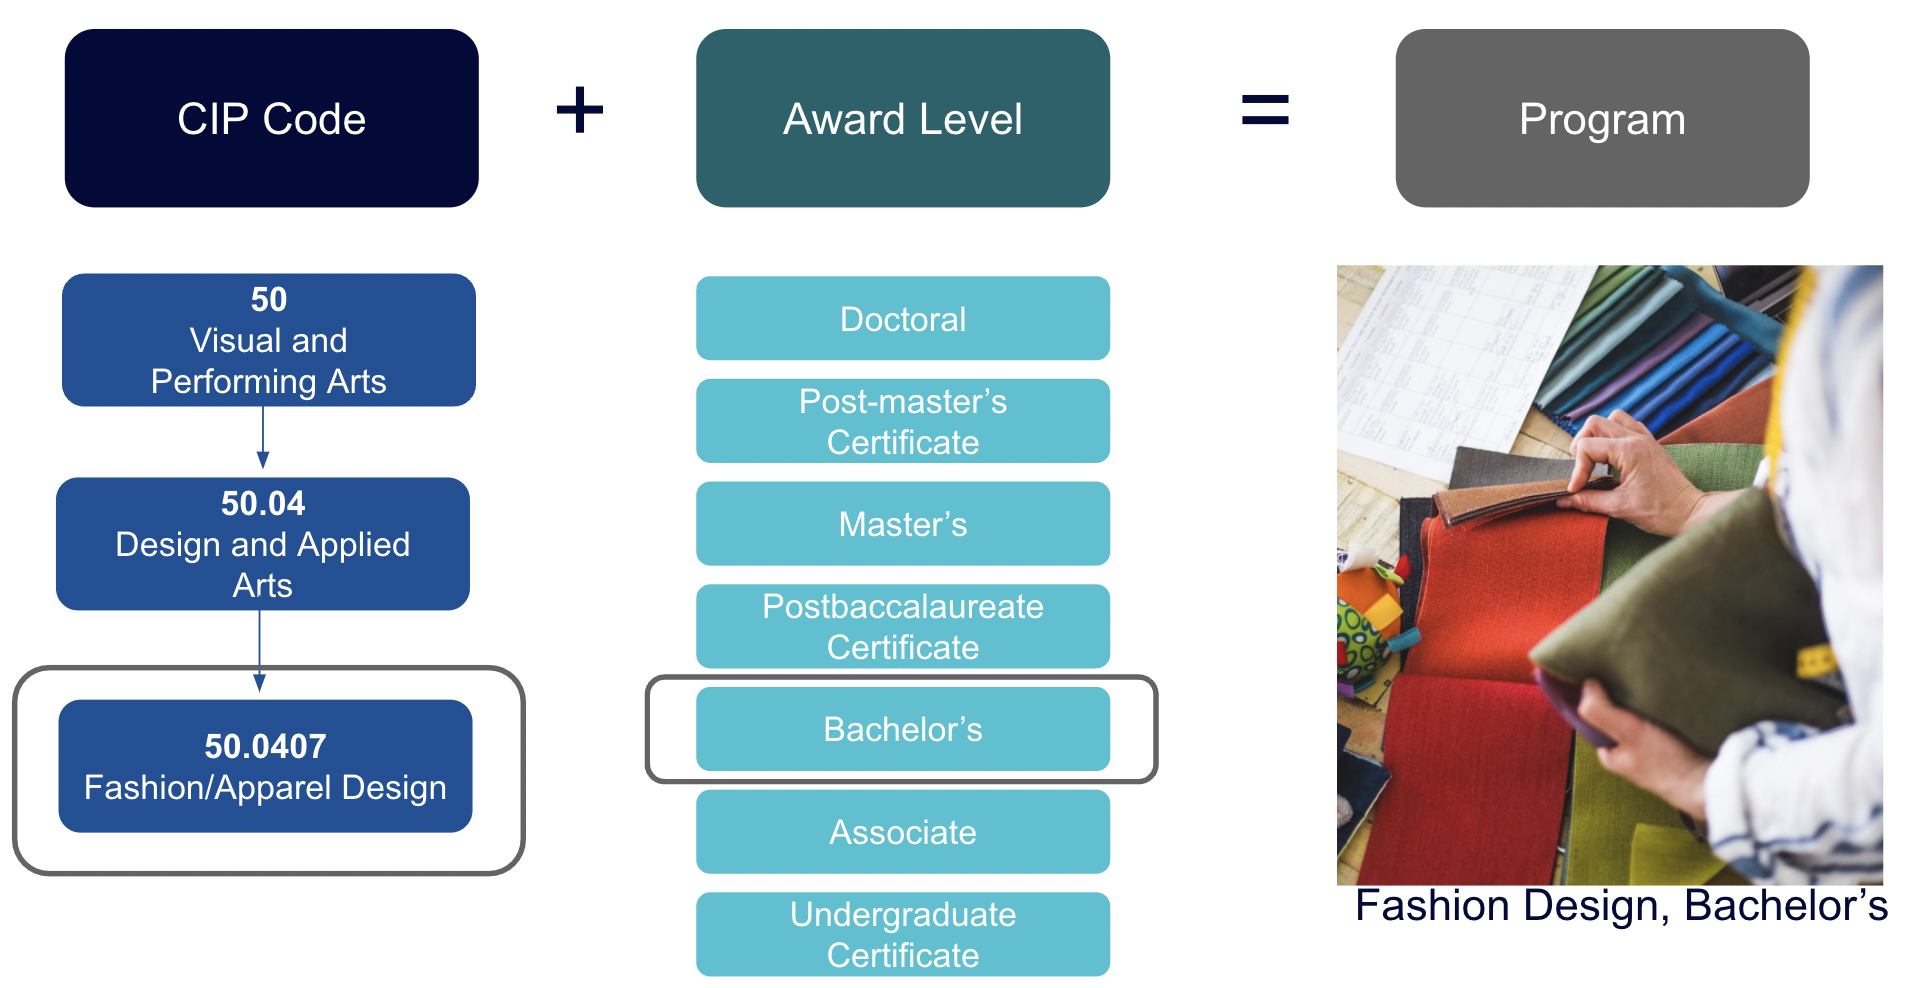 Now that we have that settled, let’s dive in.
Analyzing Competition at the Program Level
You may be thinking about starting a new program. You may have a program where you have seen a drop-off in enrollment and want to know why. In either case, knowing which competitors offer the program, how large their programs are, and whether they are growing or not can provide insights about the competitive landscape and potential market saturation.
All IPEDS institutions report completions data for programs that produce graduates each year. Every good PES should provide data at the 6-digit CIP code level, delineated by award levels and institutions. This allows users to identify relevant competitors at the program level and get a sense of how large the program is at each school.
Let’s start with a well-known program likely to have many competitors – a master’s degree in social work. As discussed in the previous two blogs, you will want to identify competitors in your core geographic market, as well as competitors located elsewhere that have a presence in your market. We will use the Atlanta, GA metropolitan area as our core market for this example.
First, we can pull data from the PES to identify three institutions that reported a total of 159 MSW completions in the Atlanta market last year (see chart below). Cohort sizes ranged from 48 to 62 graduates.
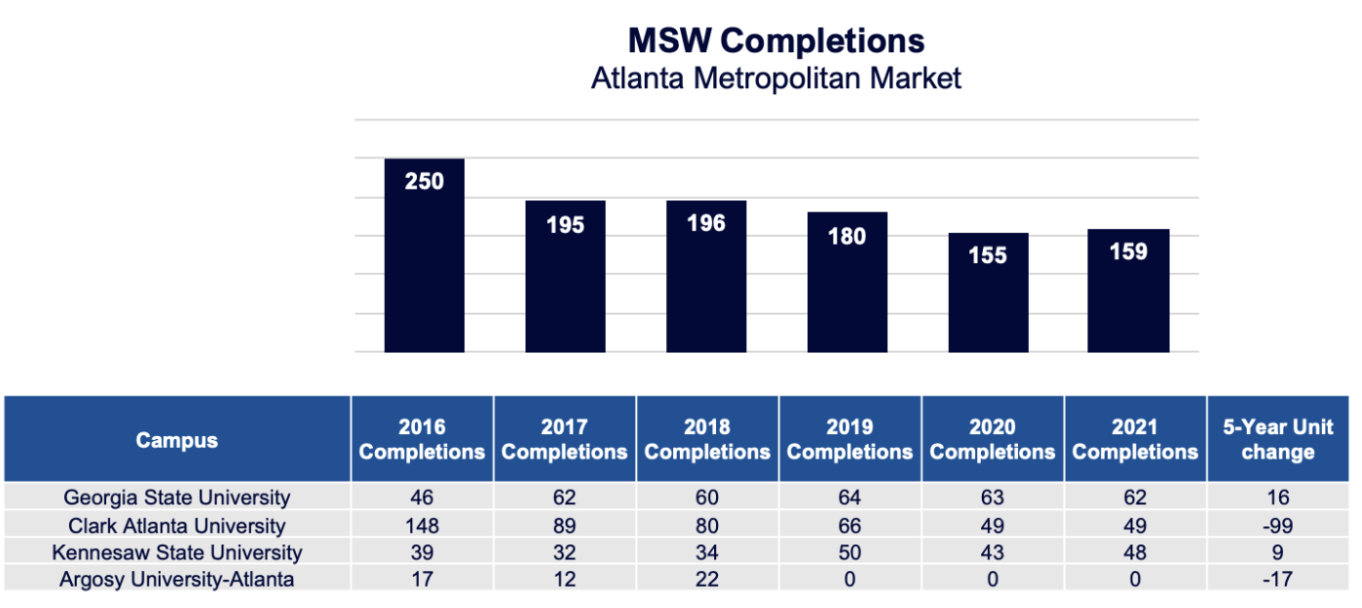 Source: Gray DI Program Evaluation System (PES)
Of note, we can also see that one institution exited the market after 2018, and total market completions dropped by 91 graduates from 2016 to 2021. Let’s compare that to national trends to understand if the program itself is declining or if it is just declining in this market.
Pulling data from Gray’s PES, we can see that US completions of MSW programs grew 18 percent from 2016 to 2021, so the decline in the Atlanta market is not mirrored nationally. Further, we can see that in 2021, 31 percent of MSW programs were completed online.
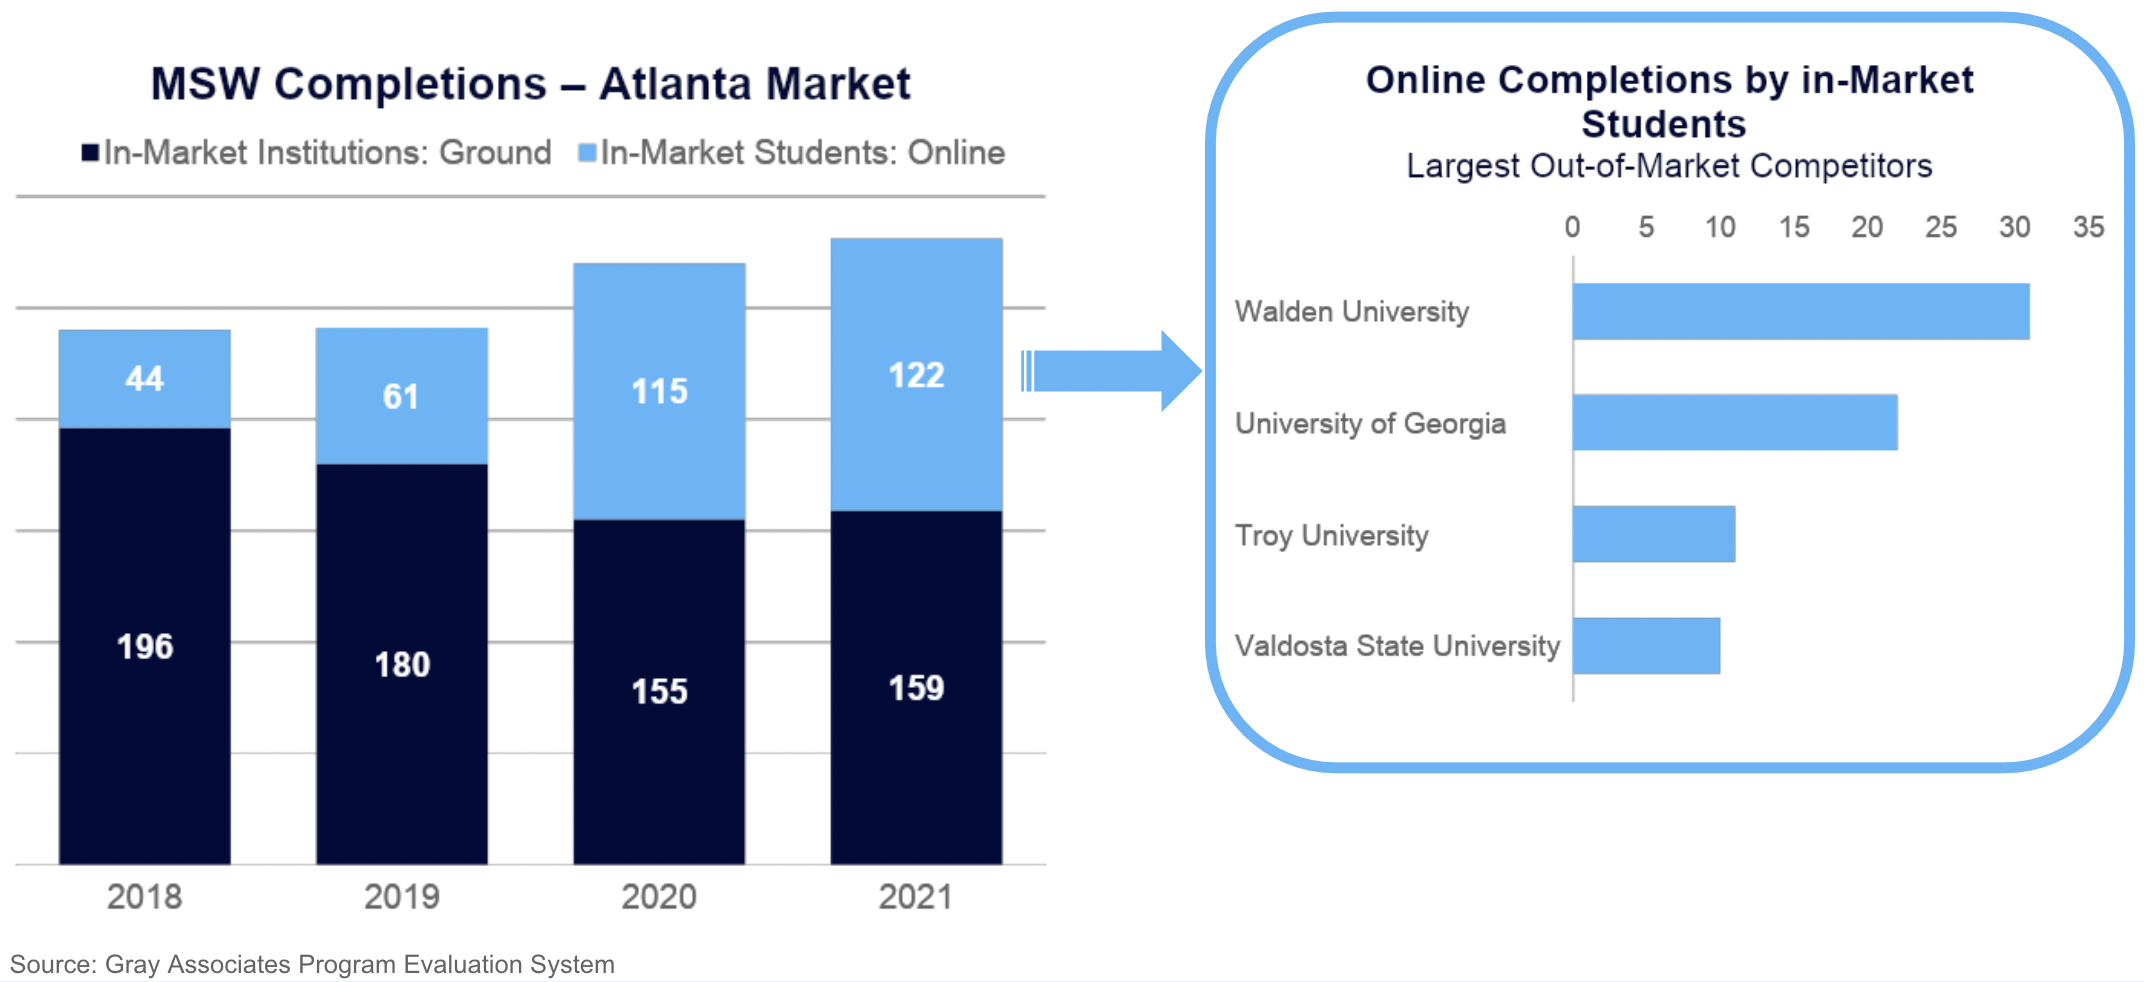
This leads us to the next question: which competitors are drawing students away from the core market? As we discussed in the second blog in this series, we can find this out by using the PES to identify the institutions in which online students in the Atlanta market are enrolling and completing their MSW degrees.
Data from Gray’s PES shows the top four online competitors for MSW students in Atlanta in the chart below. As on-ground completions at in-market institutions declined (dark blue bars in the chart on the left), online completions at out-of-market competitors grew.
 Digging Deeper Into CIP Codes
Now let’s look at another way a good PES can help you identify competitors at the program level that may not be immediately apparent. Perhaps you are thinking about starting an architecture major, and you want to understand the competitive landscape.
For this example, we’ll use the New York City metro area as our core market. We’ll start by pulling the most recent completions data from our PES for Architecture programs (CIP code 04.0201) to see there are four institutions competing in the market at the bachelor’s level.

Source: Gray DI Program Evaluation System (PES)
At first glance, this might seem like a relatively favorable competitive environment. But sometimes you need to dig a little deeper to get the whole story, and this is where a good PES is invaluable.
Let’s go back a few years to see if the competitive landscape has changed over time (see chart below). It certainly has. It appears that four institutions who used to offer the program no longer do. And the overall market size has shrunk considerably.
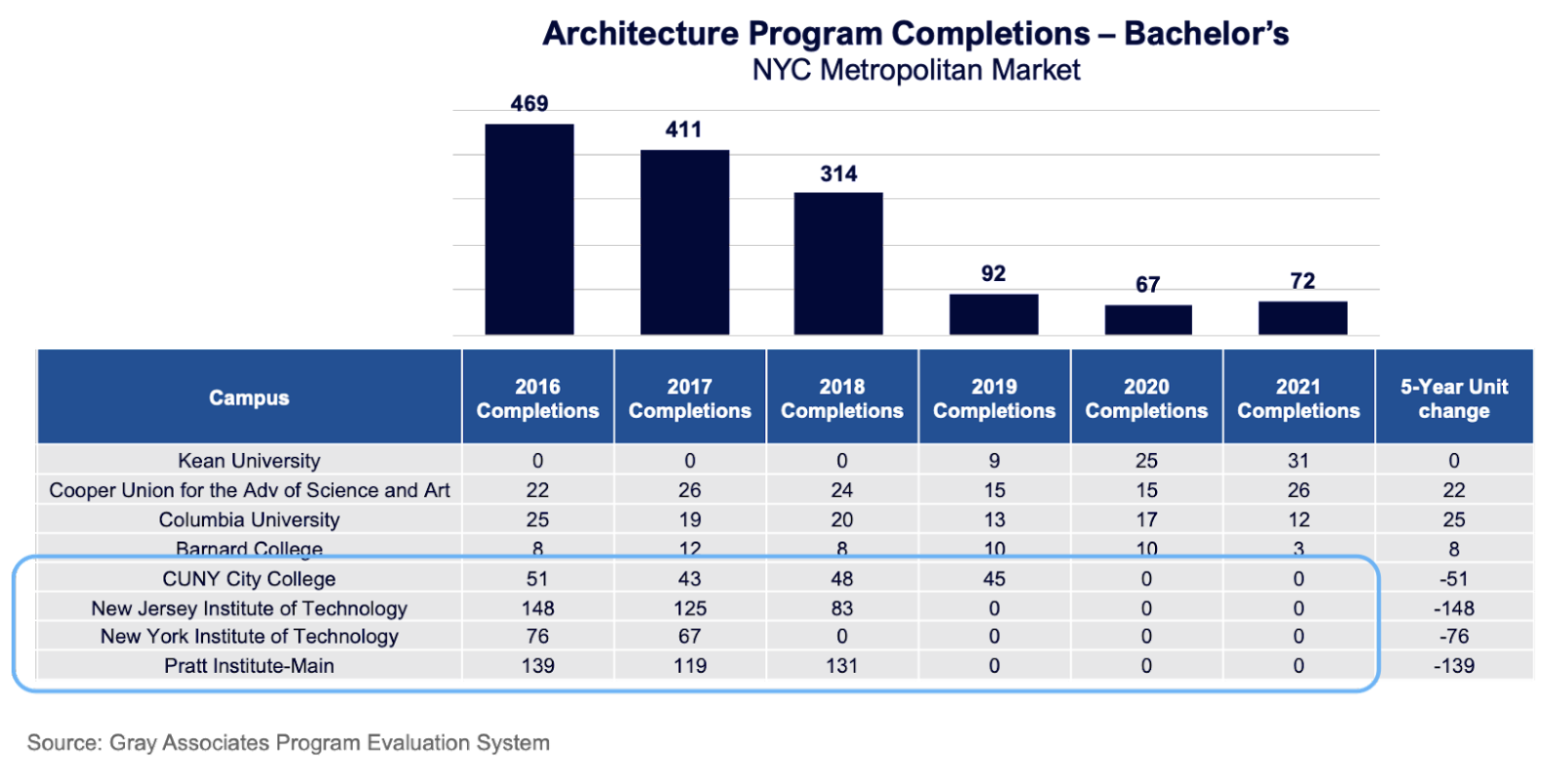 What could be going on? Here is where it gets interesting, and where a PES can help you get a more complete view of the competitive landscape for a program.
The CIP code taxonomy is periodically revised, new program codes are added, and institutions sometimes change how they classify certain programs. This is especially true for STEM-designated programs and CIP codes, which offer certain advantages to international students. Some institutions adjust existing programs, and their CIP code classifications, to align with STEM-designated programs to appeal to international students. Architecture programs are a good example.
Traditional Architecture programs are reported under CIP code 04.0201; these programs are not STEM-designated programs. However, programs classified under the Architectural & Building Sciences/Tech CIP code (04.0902) are designated STEM programs. Now, let’s use our PES to pull data for both of these programs in the NYC market.
We can see in the chart below that what appears to be a decline in competition for Architecture programs in the NYC market may actually be just a shift in CIP code reporting by some competitors. In fact, the number of competitors has actually grown from seven in 2016 to nine in 2021.
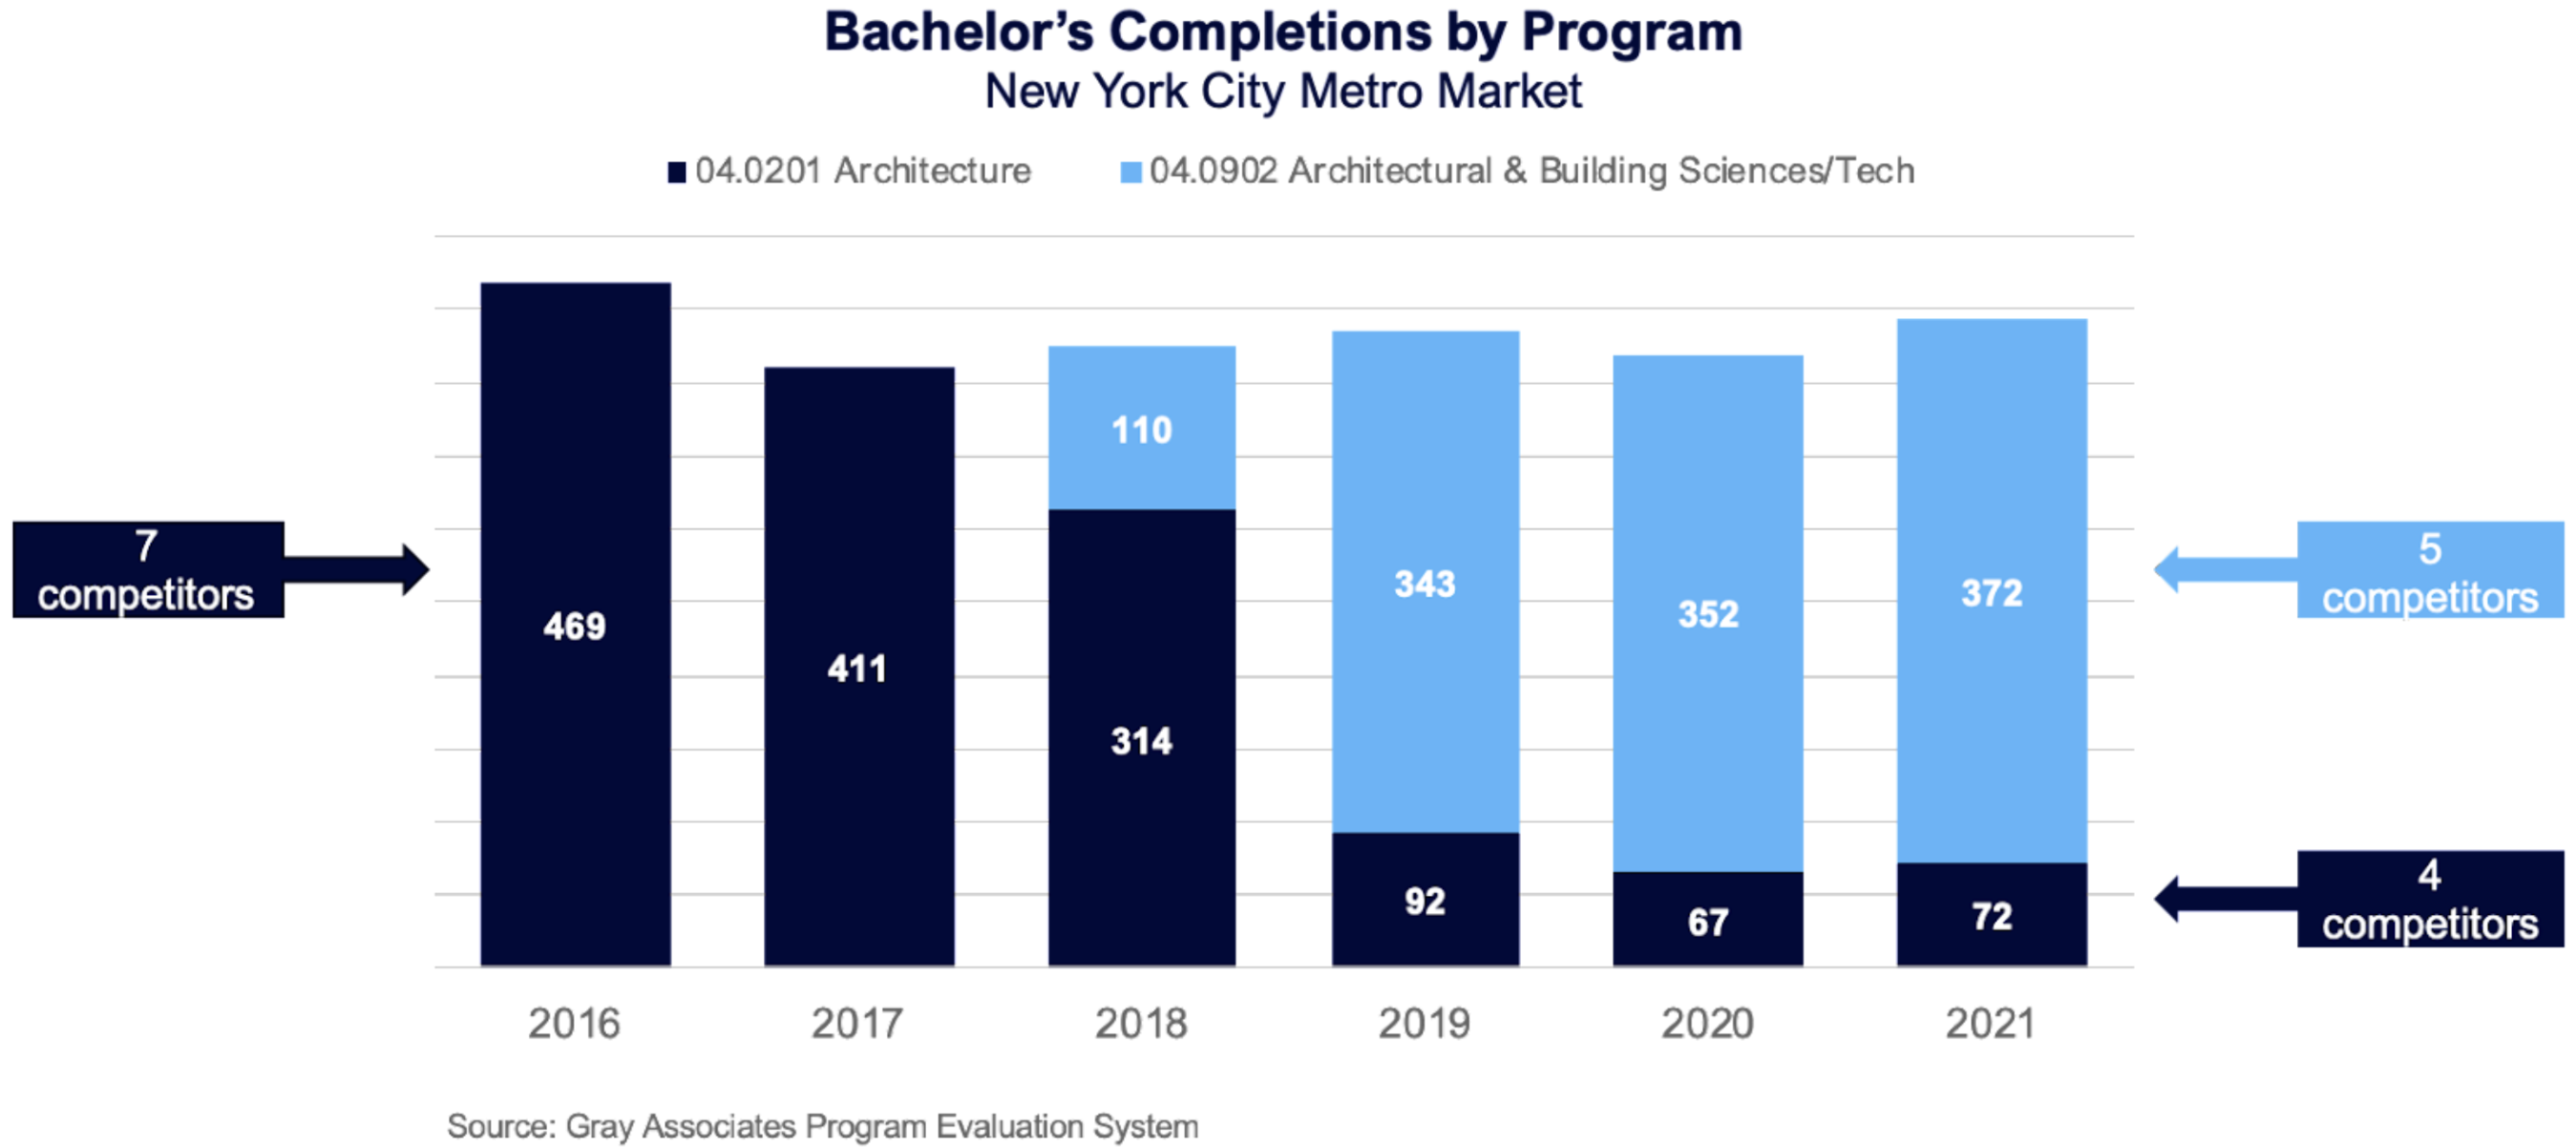
The four competitors who at first glance appeared to have exited the market may have simply adjusted their Architecture program (and CIP code classification) to align with the STEM-designated Architectural & Building Sciences/Tech program. And a new competitor, The New School, entered the market.
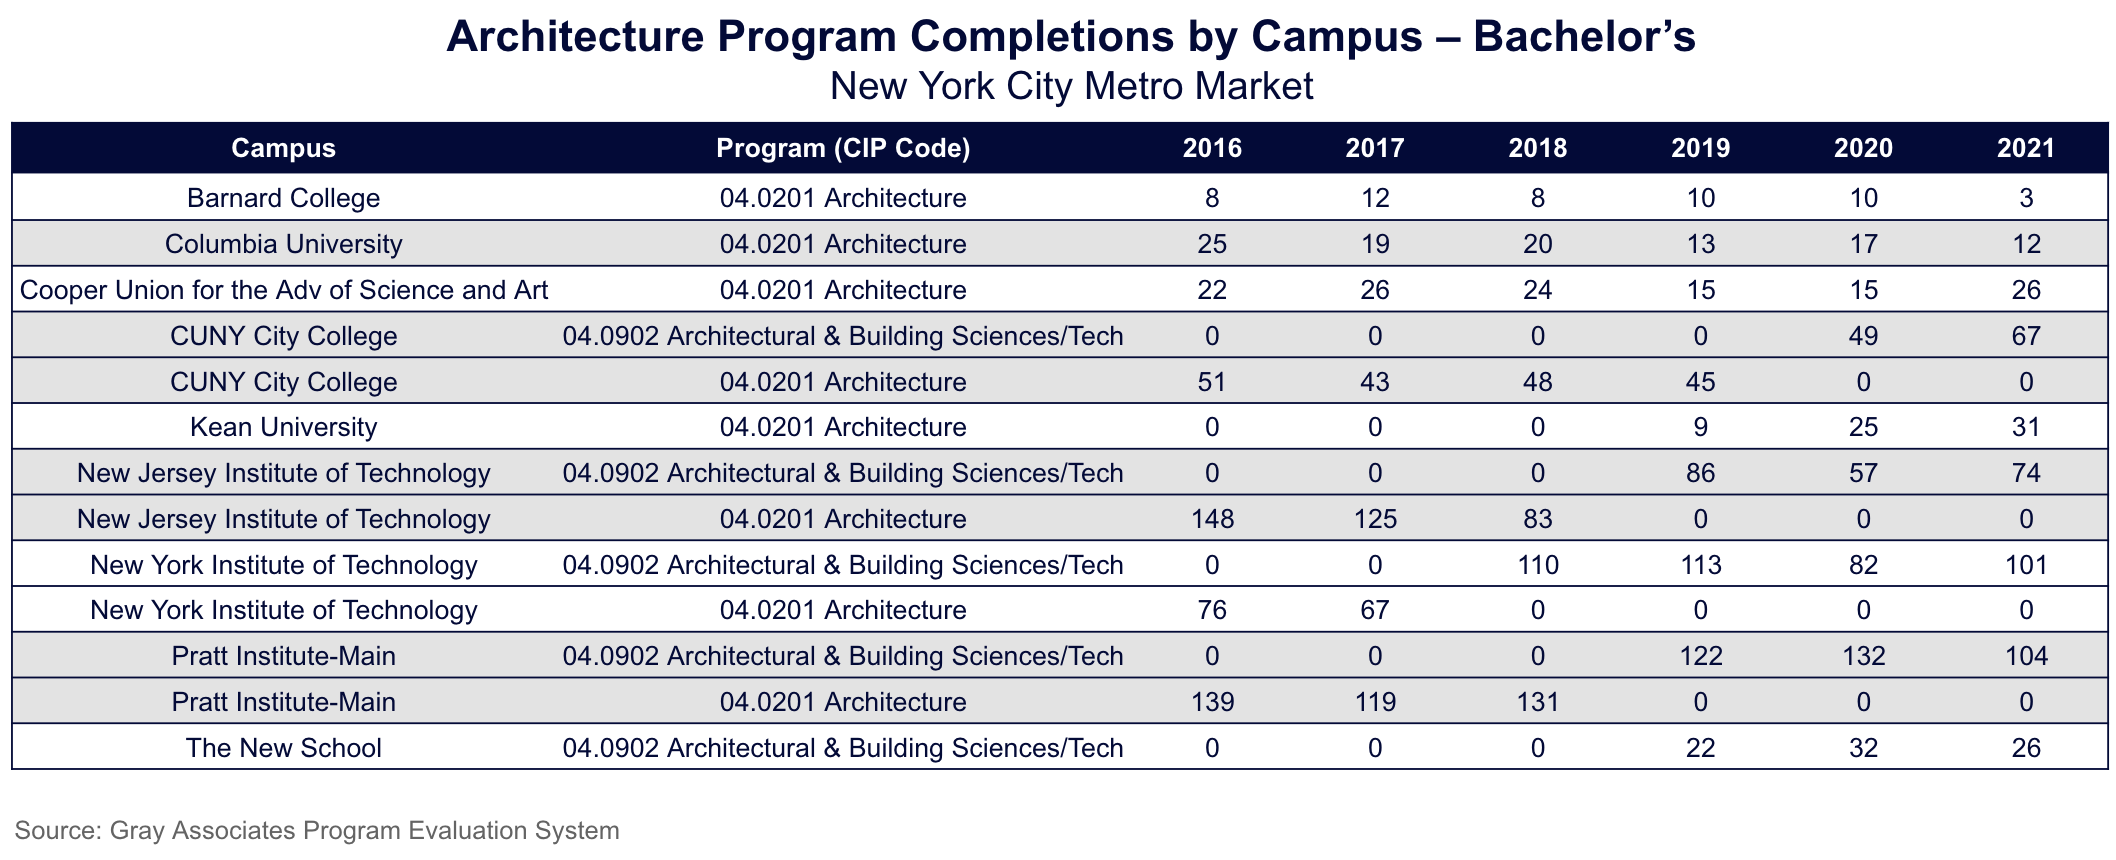
As this example shows, when using a PES to analyze competition, it is good practice to pull historic as well as current data so you can track market trends and changes in program competitors over time. You may also want to look at CIP codes similar to the specific program you are analyzing to see if there are other competitors reporting the same or similar programs to adjacent CIP codes. And you will want to check for online competitors inside and outside of your core market, especially for programs where a growing percentage of completions are occurring online.
A PES is a Critical Tool for Analyzing Competition
A good Program Evaluation System helps colleges and universities understand their competition, both at the institution and program levels. It provides data on which schools compete in your market, both on-ground and online, how large their programs are, which competitors and programs are growing and potentially taking share, and which markets and programs might have favorable competitive landscapes for growing enrollment and market share.
If you want to see how Gray’s Program Evaluation System can help your institution, click here.
In partnership with Bay Path University, Gray offers an online, asynchronous, self-paced course designed for higher-education leaders involved in Academic Program Evaluation and Management. Are you interested in this opportunity to become certified? Register here.


