
This blog series explores how to use a Program Evaluation System (PES) for competitive analysis. Your competition depends on the search process used by prospective students. Some students choose a school first and then a program or major. Others select their program first, then find the best-fit school based on this program. Your competitors will be different for school-first and program-first applicants.
This first blog will focus on identifying and tracking competitors in your core market.
Define Your Core Market:
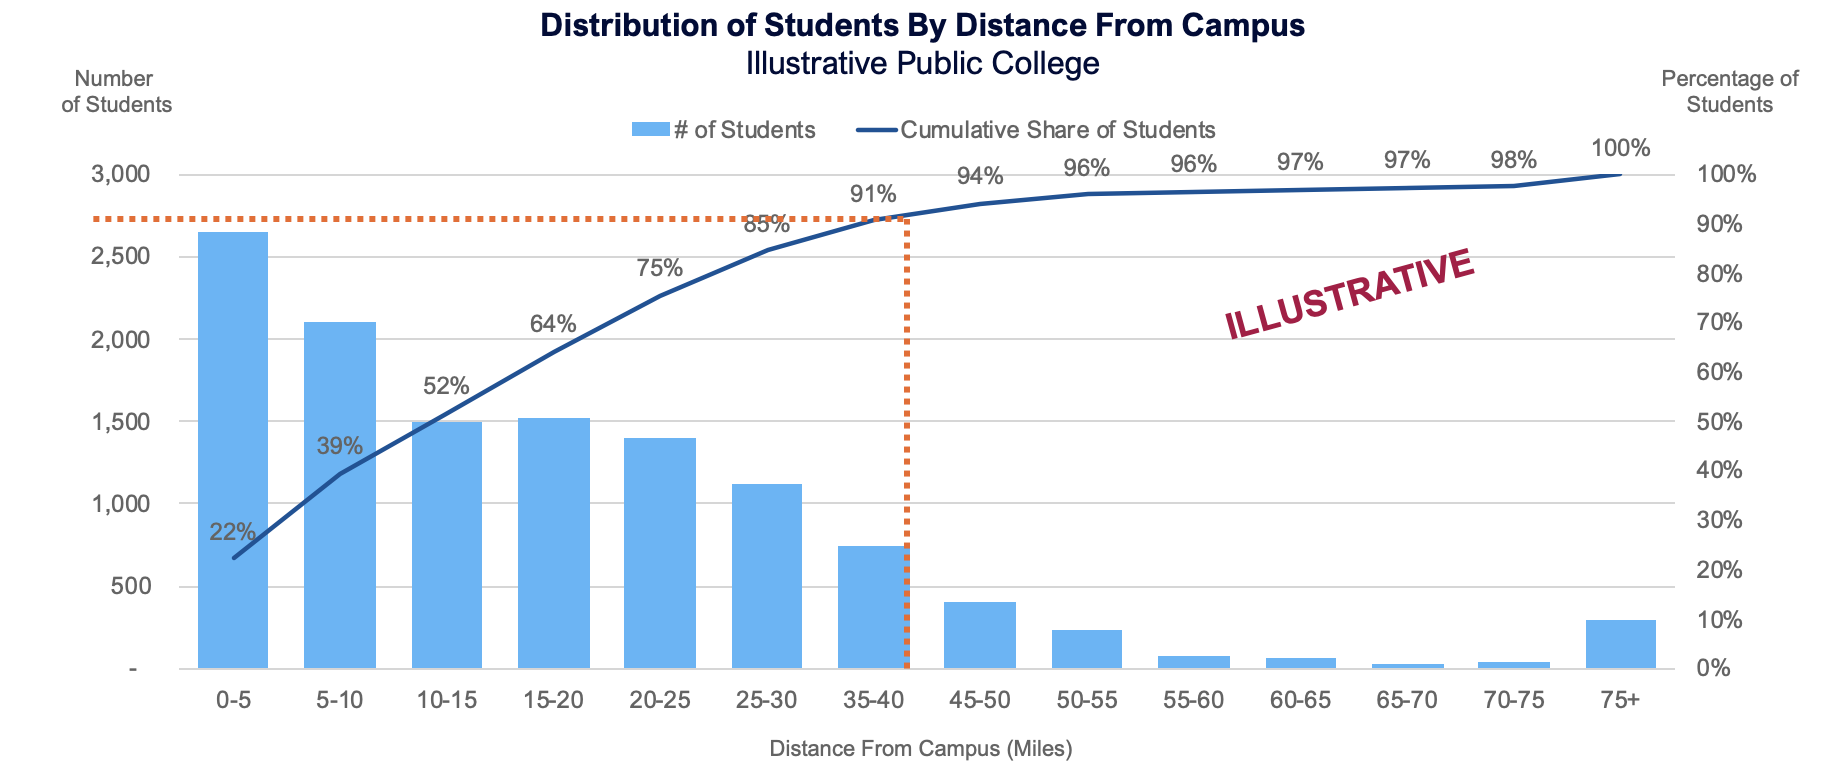
An essential competitive analysis step is defining your core geographic market. In our work with higher education institutions, we have found that many draw most of their students locally or regionally, often within a 30 – 50 mile radius around their campus. This is especially true at the undergraduate level. NCES data shows that in 2020, over 70 percent of first-time freshmen enrolled at colleges and universities in their home states.
To define your core market, Gray suggests performing a distance analysis using student address data to identify the geography from which your institution draws most of its students. An example analysis is shown below. In this instance, 91% of the institution’s students live within 40 miles of the main campus. For this school, we would create a core market definition based on a radius of 40 miles from the campus center.
 The market definition uses census tracts (roughly twice as precise as zip codes) as the building blocks for collecting market data. We might also include or exclude specific towns, cities, or regions depending on the institution’s geographic location and satellite campus locations.
Your core market definition may or may not differ by level of student. If you serve graduate and undergraduate students, you should create core market definitions for each distance analysis that shows significant variations. You may also want different market definitions for online and campus programs.
Who Competes in Your Core Market?
Once you have defined your core market, you can start identifying competitors. Now most colleges and universities already have a good idea of who they compete against. But sometimes, this view can be incomplete. It is good practice to begin by casting a wide net. To do this, we use IPEDS completions data. Though less timely than other demand metrics, IPEDS data is comprehensive and tracked at the institution level, so it is a great place to start. IPEDS excludes your market. We’ll cover these hidden competitors in a later blog post.
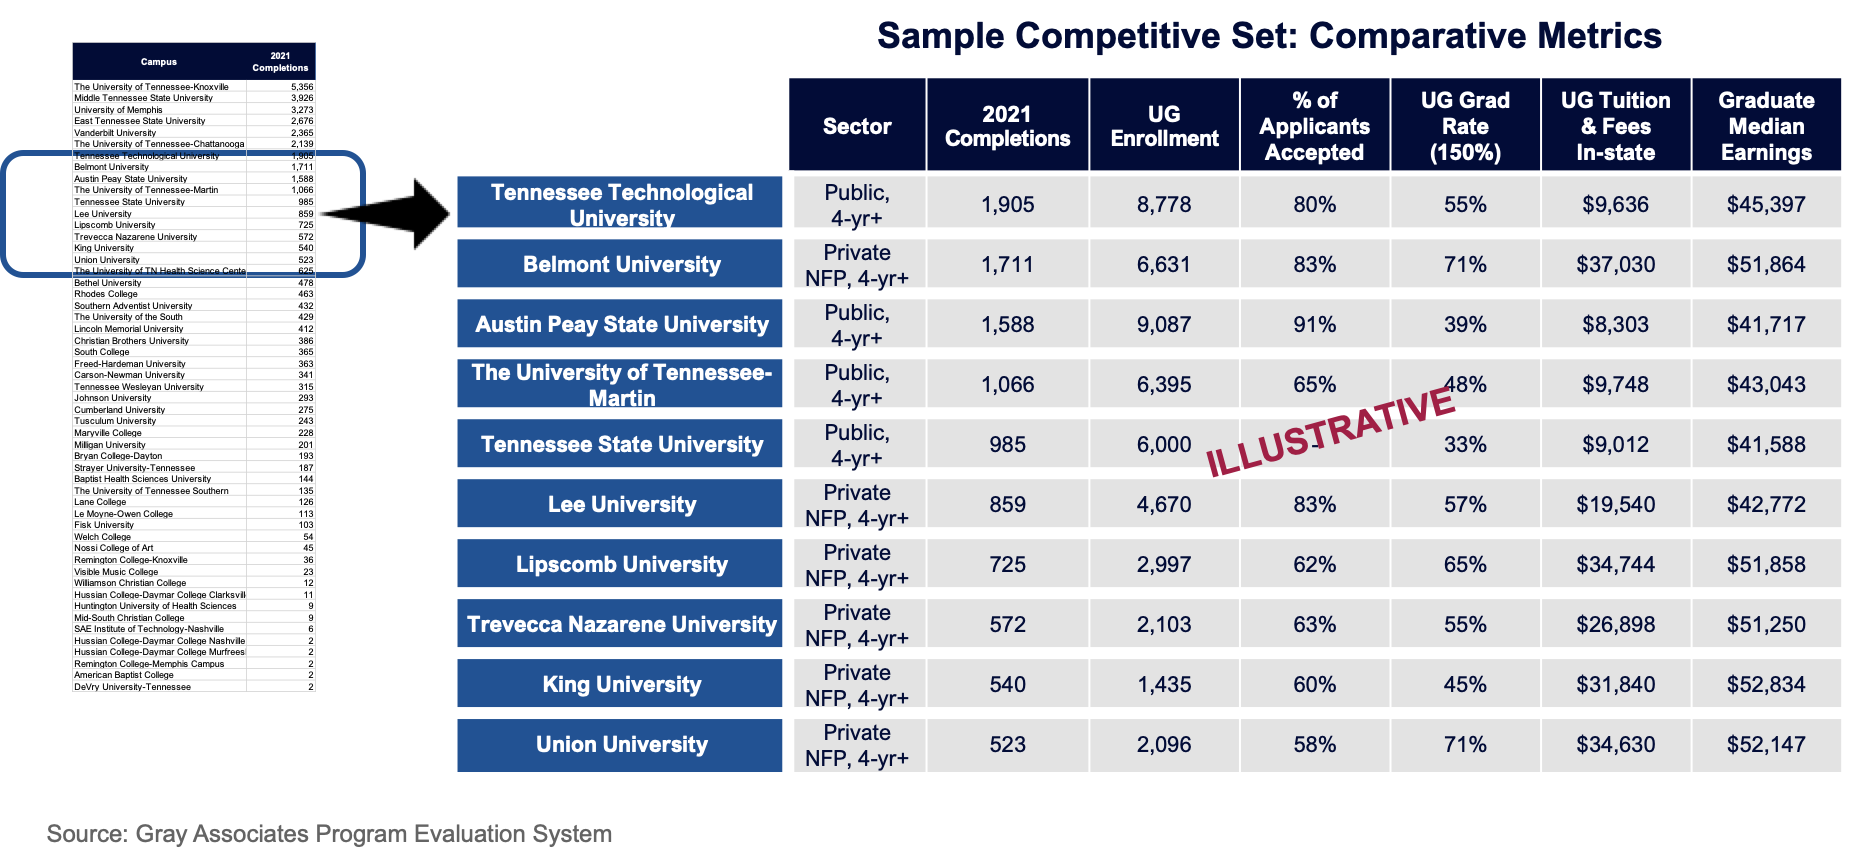
IPEDS reports completions to the headquarters location of every college or university using UNITIDs. It will show you all of the institutions that are located in your core market. Using Gray’s PES, we can see that 149 Tennessee-based institutions reported completions, across all award levels, in 2021. (Note: this blog uses state-level data for illustrative purposes. As noted above, actual market definitions will be more precise).
 Find the Most Relevant Competitors
Once you know the institutions active in your core market, you can filter the list to hone in on your most relevant competitors. For example, suppose your institution is primarily a bachelor’s degree-granting school; you can filter completions data by award level to see only those competitors that report bachelor’s completions in your market. In Tennessee, this takes the list of competitors down to 53 institutions.
Next, you can sort the list by sector to distinguish between public and private institutions or filter by completion or enrollment volumes to hone in on schools that are close to yours in size. Likewise, you can sort and filter by price, selectivity, graduate outcomes, or other metrics you deem most relevant. The illustrative table below shows comparative metrics from Gray’s PES for a sample set of ten public and private Tennessee institutions with between 500 and 2,000 completions.
 Who’s Growing, and Who’s Not?
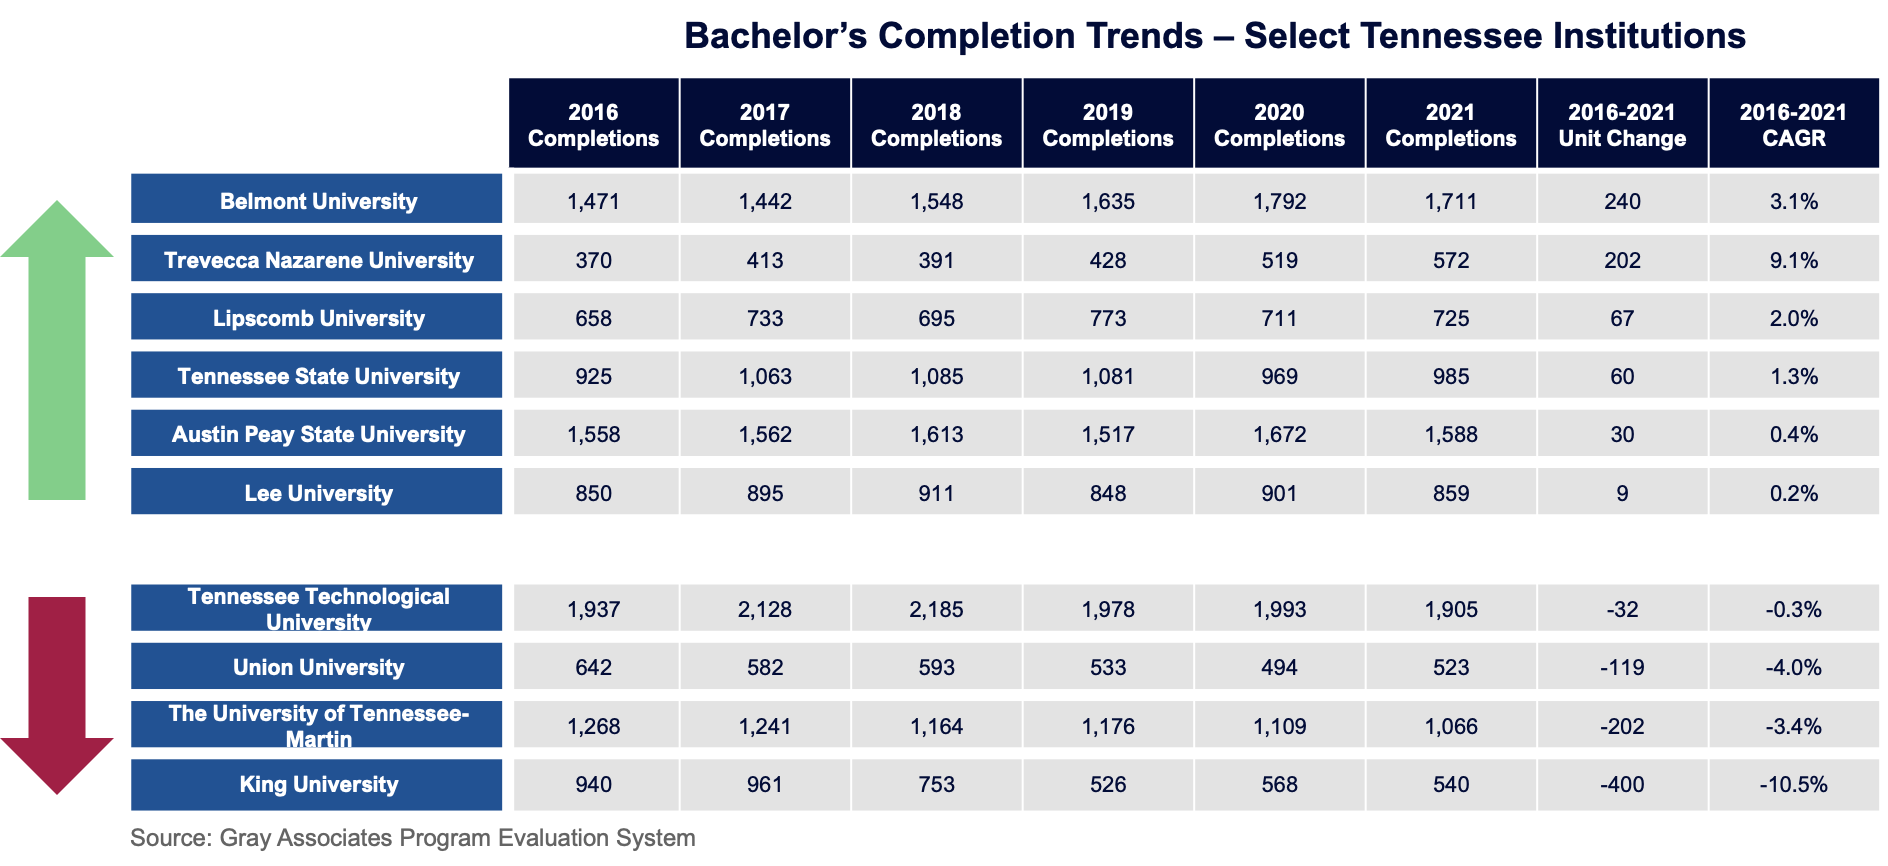
As important as identifying your competitors, you will want to understand which institutions are growing and which are not. Growing institutions may be taking share from other institutions, including yours. To do this, we suggest analyzing completions data over time. The chart below shows the number of bachelor’s completions reported by competitors from 2016 to 2021. You can see that some competitors have grown over the past few years while others have experienced declines.
New Entrants and Exits
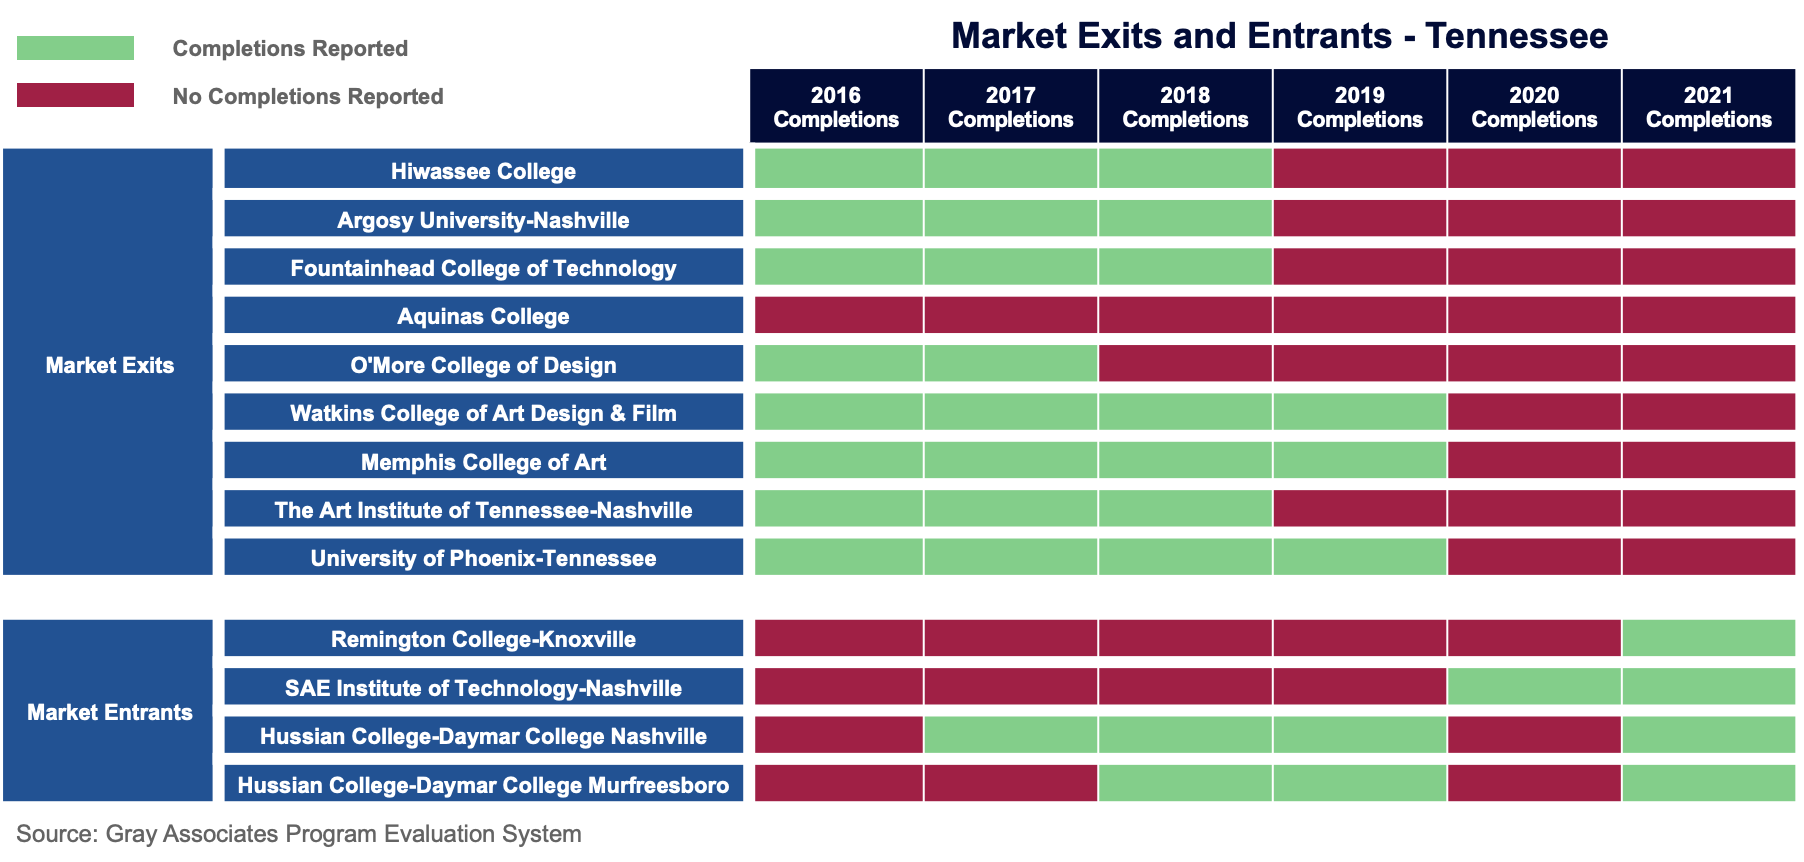
You can use completion trend data to identify competitors who recently entered or exited your market. The sample data below from Gray’s PES shows nine TN schools that stopped reporting completions from 2016 to 2021, indicating these schools may have closed or consolidated campuses. On the flip side, we can see four new competitors that appear to have entered the market during this period and began reporting completions.
 Brand Awareness
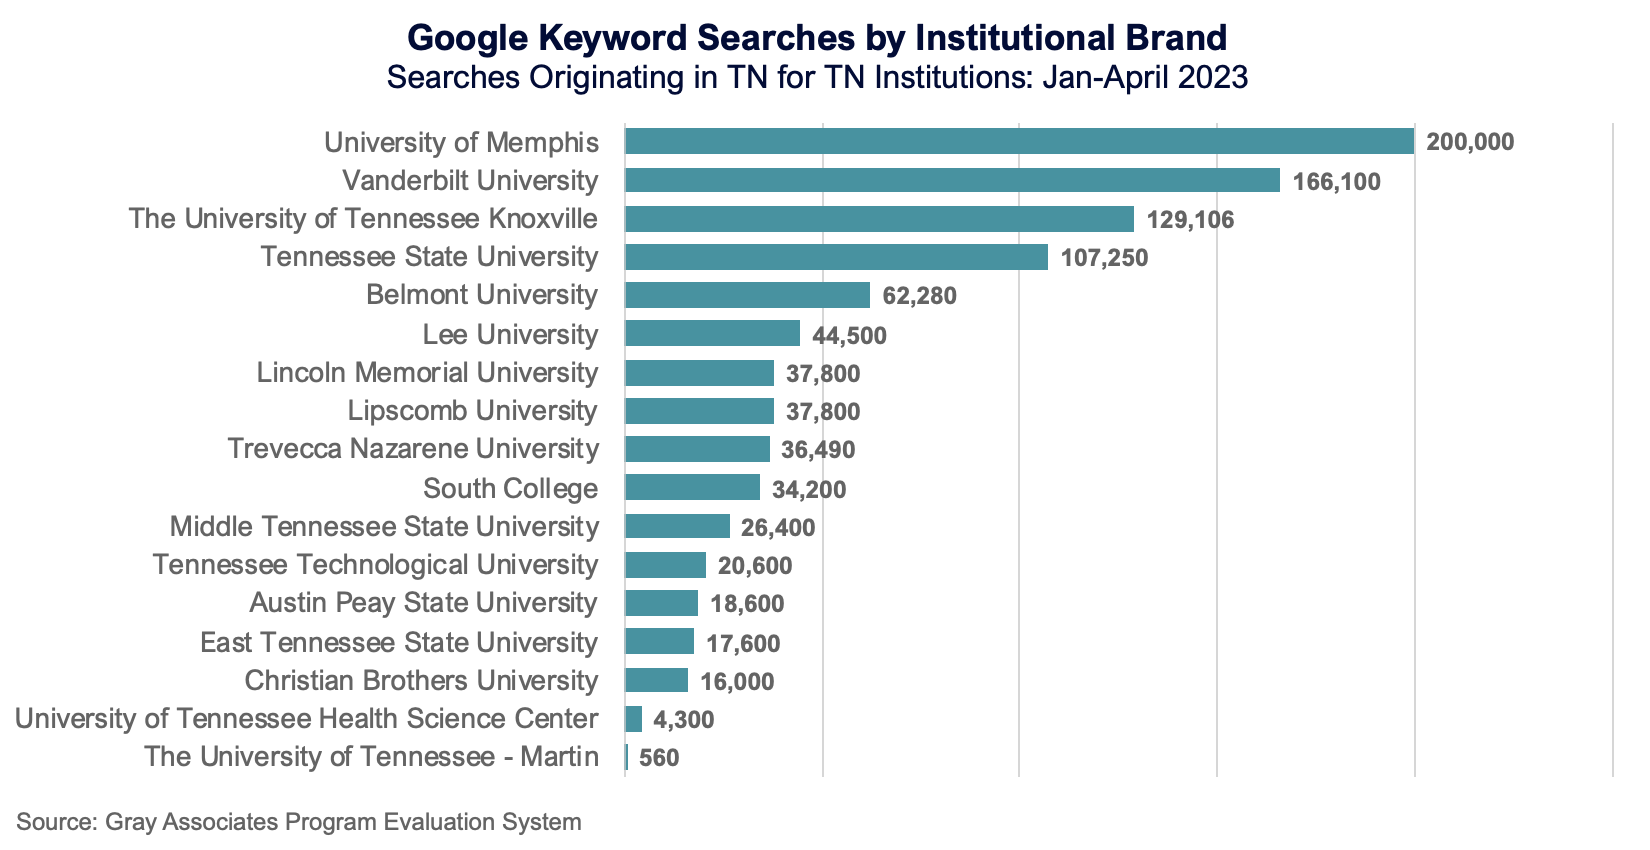
Once you have identified relevant competitors, you can see how your brand compares to theirs. We do this by tracking Google keyword searches for institutions. The chart below shows keyword search volumes for searches originating in Tennessee for a sample of the state’s institutions. As you can see, brand awareness varies significantly and gives insights into which brands are most well-known among prospective students.
 Up Next
Identifying and benchmarking competitors in your core market is a key first step in using a Program Evaluation System for competitive analysis. The following blog in this series will discuss using a Program Evaluation System to identify competitors outside of your core market, including hidden competitors, who are invisible in traditional data sources.