
Strategic academic planning is evolving from a matter of collegial consensus to a high-stakes struggle for institutional survival. University leaders can no longer rely on self-interest, intuition, and aspirational myths to guide decisions about which degree and non-degree programs to grow, shrink, start, or sunset. They need granular insight into how individual programs create value and generate revenue, cost, and margin. Such insight can be obtained only by reflecting on detailed and suitably processed empirical data.
Suitable processing begins with the details of instructional activities down to the level of individual programs, courses, and departments. Campus-level aggregates are not sufficient. A Program Economics data-analysis system like the one offered by GrayDI allows you to examine the detailed history of your instructional activities.
But historical analysis is not enough. You must visualize consequences of adding or subtracting programs or changing enrollment patterns in other ways. Such visualization requires answering “what-if” questions: what will happen if I do X, or Y, or Z, or all of them together? Doing so is the domain of Predictive Program Economics (PPE for short).
This blog is the first of a series that describes my PPE work with Gray DI. It introduces the concepts that underlie the predictive models. Subsequent offerings will elaborate the ideas and provide sample results.
The Strategic Variables: Levers of Change
Predictive Program Economics does not amalgamate qualitatively defined aspirations. It is executed through a specific set of “controllables” that define a university’s position in the marketplace of academic capitalism and capacities for delivering educational content. These variables are the primary levers of change available to leadership.
- Student Enrollments: While Student Credit Hours (SCH) serve as a common budgetary driver, PPE demands a disaggregation into FTEs and headcounts. This allows for accurate modeling of the “pipeline effect,” tracking student cohorts from matriculation through graduation, and predicting the resources that will be required to provide instruction.
- Academic Programs: These represent the bridge between market demand and university supply. Strategy is defined by the roster of programs offered and the enrollment targets set for each.
- Pricing and Net Tuition: Gross and net tuition rates are the primary determinants of revenue. PPE recognizes that while student revenue is roughly linear—tuition acting as the proportionality factor—the cost of those enrollments is fundamentally non-linear.
- Faculty Resources: PPE distinguishes between regular faculty (tenured or multi-year contracts) and adjunct faculty. Crucially, while regular faculty are treated as “fixed” cost within a single budget year, they must be treated as “variable” cost in long-term strategic planning, in order to maintain sustainable teaching loads.
- IT Infrastructure and Physical Plant: these important variables can be treated similarly to the proceeding, but that is beyond our scope here.
Understanding the interaction among these variables reveals a fundamental truth: the non-linear nature of instructional costs subverts standard budgeting. Pulling decision levers based on average cost data—the traditional standard—is akin to navigating with a badly calibrated compass.
How Instructional Costs are Generated
PPE focuses on direct instructional costs—the compensation of teachers and direct instructional support [e.g., assistants and supplies)—although the costs of administrating programs and departments also may enter the picture. The economic drama of instructional cost begins at the micro-level of the course section. Then it shifts to the program level, where the course costs are added up and compared with student revenue to produce estimate of program margin.
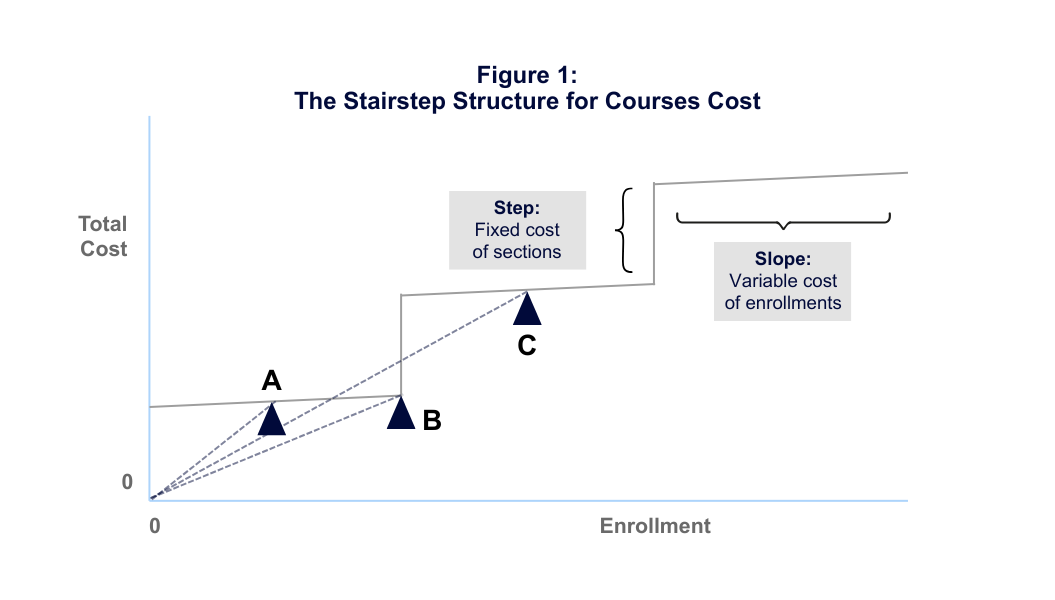
The Stairstep: Section-level instructional costs depend on the widespread practice of “batch processing” students into class sections. This diagram illustrates the non-proportional behavior of cost due to the stairstep. Cost remains essentially constant as enrollment increases from A to B along the horizontal axis. The slight upward slope represents the small variable costs (graders, lab supplies, or materials) associated with each additional student. A “step” increase—the riser—is triggered when the section’s maximum class size is reached (at B). This is the cost of adding an entirely new section. The process repeats itself as further enrollments are added (from B to C).
Most universities operate many courses with one or a few sections. Hence the relation between and enrollment and cost is highly non-linear. Future blogs dig more deeply into the stairstep’s implications for decision-making.
Mapping Course Costs to Programs: Students take courses but they register for programs. Program cost estimation requires mapping the costs of course enrollments to programs.
Step 1 allocates each course’s cost-per-enrollment across programs in proportion to the programs’ enrollment shares. This is standard cost accounting, but one must be careful when interpreting the results.
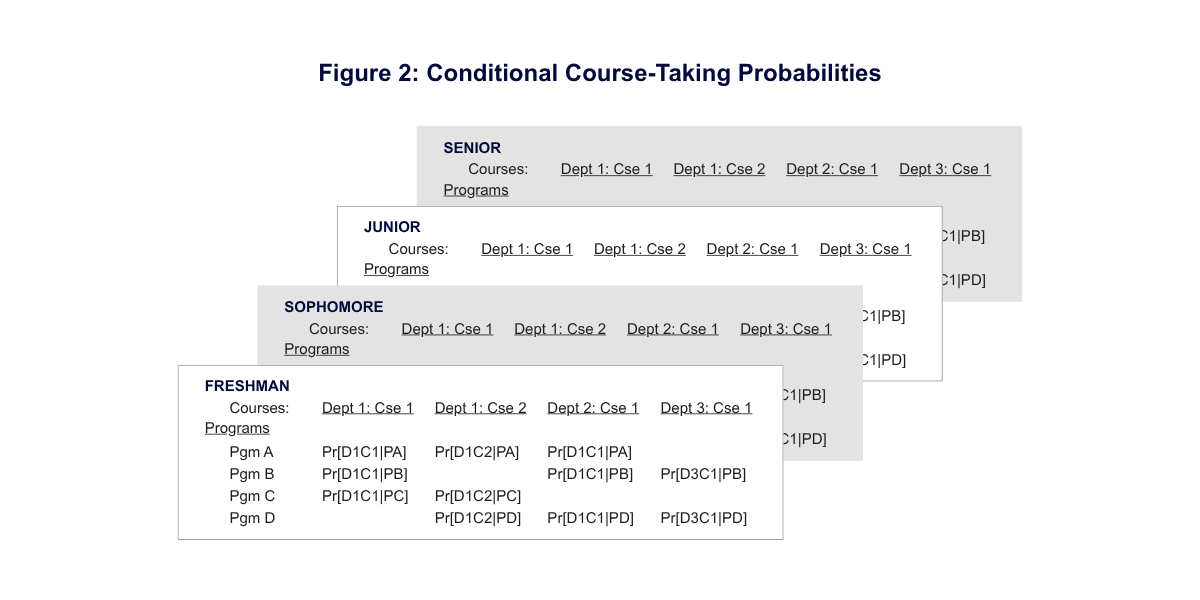
Step 2 allocates each program’s enrollments across courses, in proportion to the conditional probabilities like those displayed in Figure 2. Read these as, “Probability of taking the column-designated course if the student is registered in the row-designated program.” The probabilities surely depend on student cohort (freshman, sophomore, etc.). They also may depend on student characterstics (e.g., athlete or non-athlete). The inverse conditional probabilities, from courses back to programs, are used elsewhere in the analysis. These are huge arrays but the computer handles them easily (the software excludes all the zeros).
This calculates the expected value of cost for each program, conditional on its enrollment in each student cohort and segment. The stairstep’s non-linearity carries through to the program level, but with some additional twists due to the summing-up process. Program revenue is roughly proportional to enrollment, as noted above. Therefore, program margin follows its own non-linear pattern.
Average vs. Incremental Costs
The non-linearity of cost and margin means that their average values—total dollars divided by total usage—differ significantly from their incremental values. Relying on averages is necessary and useful for analyzing historical data, but this is unnecessary, misleading, and confusing when predicting the economics future enrollment changes. Using the averages of cost accounting is a good move toward data-driven decision-making, but it’s not as good as using incremental cost. Future blogs will describe why the calculation of incremental cost requires a predictive program economics (PPE) model.
Standard cost accounting creates a “ripple effect” where an enrollment change in a single program erroneously alters the calculated average costs for all other programs, even if those programs remain static. Furthermore, the data suggest that average costs can overestimate the cost of program growth by as much as 50%, or underestimate it by up to 1/3 depending on the circumstances. This leads to sub-optimal decisions, causing institutions to miss opportunities for efficient expansion or to incorrectly sunset programs where expected incremental savings will not materialize.
Course Capacity Utilization: The Hidden Economic Driver
The empty seat is the most overlooked asset on campus. Capacity utilization is not merely an operational metric; it is the primary short-term driver of incremental cost. PPE distinguishes between two types of excess capacity:
- ‘Expedient’ Excess Capacity: Resulting from requirements for student progression, frictions of scheduling, or last-minute cancellations.
- ‘Deadweight’ Excess Capacity: Resulting from poor scheduling, teacher workload preferences, or facility mismatches.
The revealed truth for university leaders is that adding a student to a course with an existing empty seat usually incurs very little cost. Conversely, adding a student who triggers the “riser” of a new section triggers a significant expenditure. Therefore, cutting “deadweight” capacity is the fastest way to improve both average and incremental costs across the entire institution. By aggressively managing the “empty seat,” leaders can accommodate enrollment growth without the proportional cost increases predicted by aggregate models that ignore capacity utilization.
Program Portfolios: Synergy and Strategy
Predictive Program Economics invites a fundamental pivot from analyzing programs in isolation to viewing them as a cohesive portfolio. This shift is important because the combined economic and academic effect of an institution’s offerings may differ significantly from the simple sum of its individual parts. There is an analogy to modern investment management, where selecting individual stocks is secondary to managing the collective risk and return profile. This broader view recognizes that a program’s true value is defined by its contribution to the institutional whole, a phenomenon that in our case is driven by the underlying programmatic synergies.
Program synergies appear in educational content creation or student demand. Supply-side synergies may involve the sharing of courses and instructional resources. Demand-side synergies may involve marketing efficiencies and mutually supportive institutional reputation—matters than can be explored using data on markets, competition, and demand and then incorporated into the program portfolio database. PPE prioritizes the supply side because it’s concerned with instructional costs and margins.
PPE’s methods for measuring incremental cost can be extended to include supply side synergies. Knowing where these exist can be important for strategic thinking—including the identification of new program opportunities. It also may be possible to incorporate them in models for optimizing program portfolio performance.
PPE also includes strategic surrogates for teaching and learning quality. The state of the art does not support comparable quality measurement across the curriculum—and such efforts are more likely to harmful than beneficial. But the bald fact remains that cost-cutting carried too far will hurt quality, perhaps very badly. Because program economics must include cost, surrogates for quality also must be included as balancing factors.
Therefore, in PPE, calculations for variables like average class size, teaching loads, and adjunct faculty utilization should be juxtapositioned with every cost measure. Observing trends in the surrogates can alert administrators and faculty to potential adverse effects from cost-cutting and similar actions.
I’ll explore these and related ideas in future Blogs.