
Subtitle: The Numbers Behind the Demographic Cliff
Welcome to the second blog in our series on the myths and realities of higher education in the U.S. In the first blog in this series, we aimed to shock you with the data behind South Korea’s serious enrollment crisis. Now that you’ve seen the calamity in South Korea, let’s take a look at what is happening in the U.S.
For years, U.S. colleges and universities have operated under the looming shadow of Nathan D. Grawe’s influential prediction in his book, Demographics and the Demand for Higher Education. Grawe forecast a “demographic cliff” beginning in 2026 that would devastate enrollment numbers.
However, a closer look at the data suggests that while the challenge is real, the “cliff” might be more of a bunny hill – a statistical illusion rather than a full-on catastrophe.
The Roots of the Prediction
Grawe predicted a rapid decline in college enrollment caused by a drop in birth rates during the Great Recession, which would reduce the number of high school graduates, and by changes in ethnic composition that would lead to lower college attendance rates.
According to Grawe, there would be a decline in White high school graduates, who are more likely to attend college. Demographic growth would be in segments that are less likely to attend college, specifically Hispanic and “Other” students. As a result, overall college attendance would decline. The book also emphasized that these trends would vary by region in the U.S., with northern and eastern states declining while some southern and western states would continue to grow. Small, rural, independent colleges would face the greatest challenge. Overall, the decline was expected to start in 2026.
Headwind vs. Cliff: It’s All in the Scale
A critical chart in Grawe’s book showed an enrollment cliff beginning in 2026 (below left). At first glance, the drop-off is drastic. But on closer examination, the chart used a bit of statistical chicanery to make its point: the vertical (y-axis) scale starts at 2,400, not zero, which makes the decline look very steep.
We redrew the chart, with the scale starting at zero (bottom right). The decline remains clear, but more gradual. If the forecast proves correct, it would still be a headwind, but not a cliff.
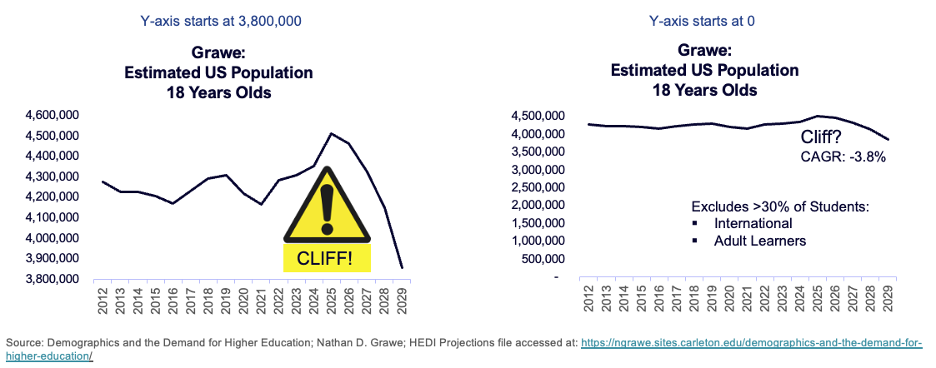
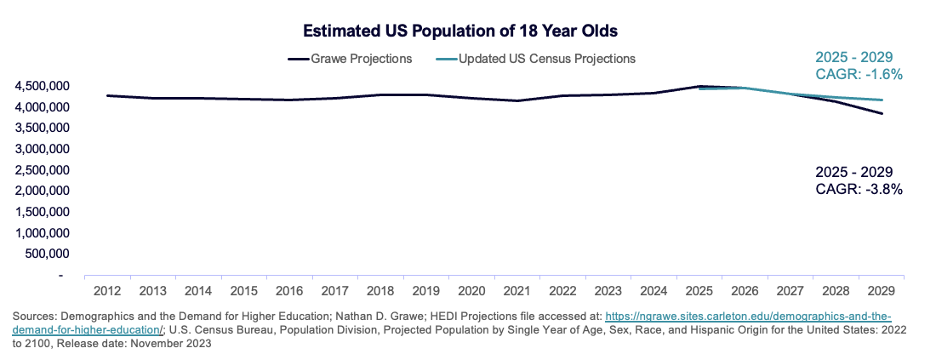
The data reflected in the charts above were based on population projections from the last decade. Since then, the Census has produced an updated projection. From 2025-2029, Grawe projected an annual decline of 3.8% in the number of 18-year-olds, but newer Census data projects a much less startling decline: 1.6%.
Missing Variables: Adult and International Students
Grawe’s “cliff” narrative focuses almost exclusively on traditional U.S. high school graduates while ignoring two critical populations: adult and international students, who together account for over one-third of higher education enrollment.
Adult learners are typically defined as college students aged 25 or older; within this group, working-age people with some college but no degree are a key segment, totaling over 43 million. Almost one-third (32%) of college students were adult learners in fall 2023. This segment is overlooked in Grawe’s analysis.
Second, Grawe overlooked international students. Millions of high school graduates around the world still dream of coming to college in the U.S. With over 1.2 million degree-seeking international students in 2023-24, they account for about 5% of all enrollment.
Key Takeaways:
- The traditional college-going population is not changing as steeply as Grawe’s dramatic visual representation suggests.
- Entire student populations (international and adult) are missing from the analysis.
That said, higher education is facing enrollment challenges that cannot be ignored but cannot be explained by demographics alone. Enrollment in college is a complex phenomenon, certainly affected by demographics, but also by the economy, social attitudes towards higher education, changes in spending power, state and federal policies, and many other variables.
In our next set of blogs, we will examine some of the theoretical culprits behind the enrollment decline.