
For higher education institutions, launching a new degree program is a high-stakes investment. Traditionally, these decisions relied on faculty expertise or regional anecdotes. Today, however, institutions can use a more rigorous, data-informed approach to minimize risk.
According to research and frameworks developed by Gray Decision Intelligence (Graydi.us), determining demand requires a balanced analysis of student interest, employer needs, and market saturation.
The Core Framework: Four Dimensions of Program Demand
To determine if a program is viable, universities typically score potential offerings across four distinct categories:
1. Student Demand (The Enrollment Funnel)
Student demand is the most significant predictor of a program’s success. Institutions look at three specific data layers to gauge interest:
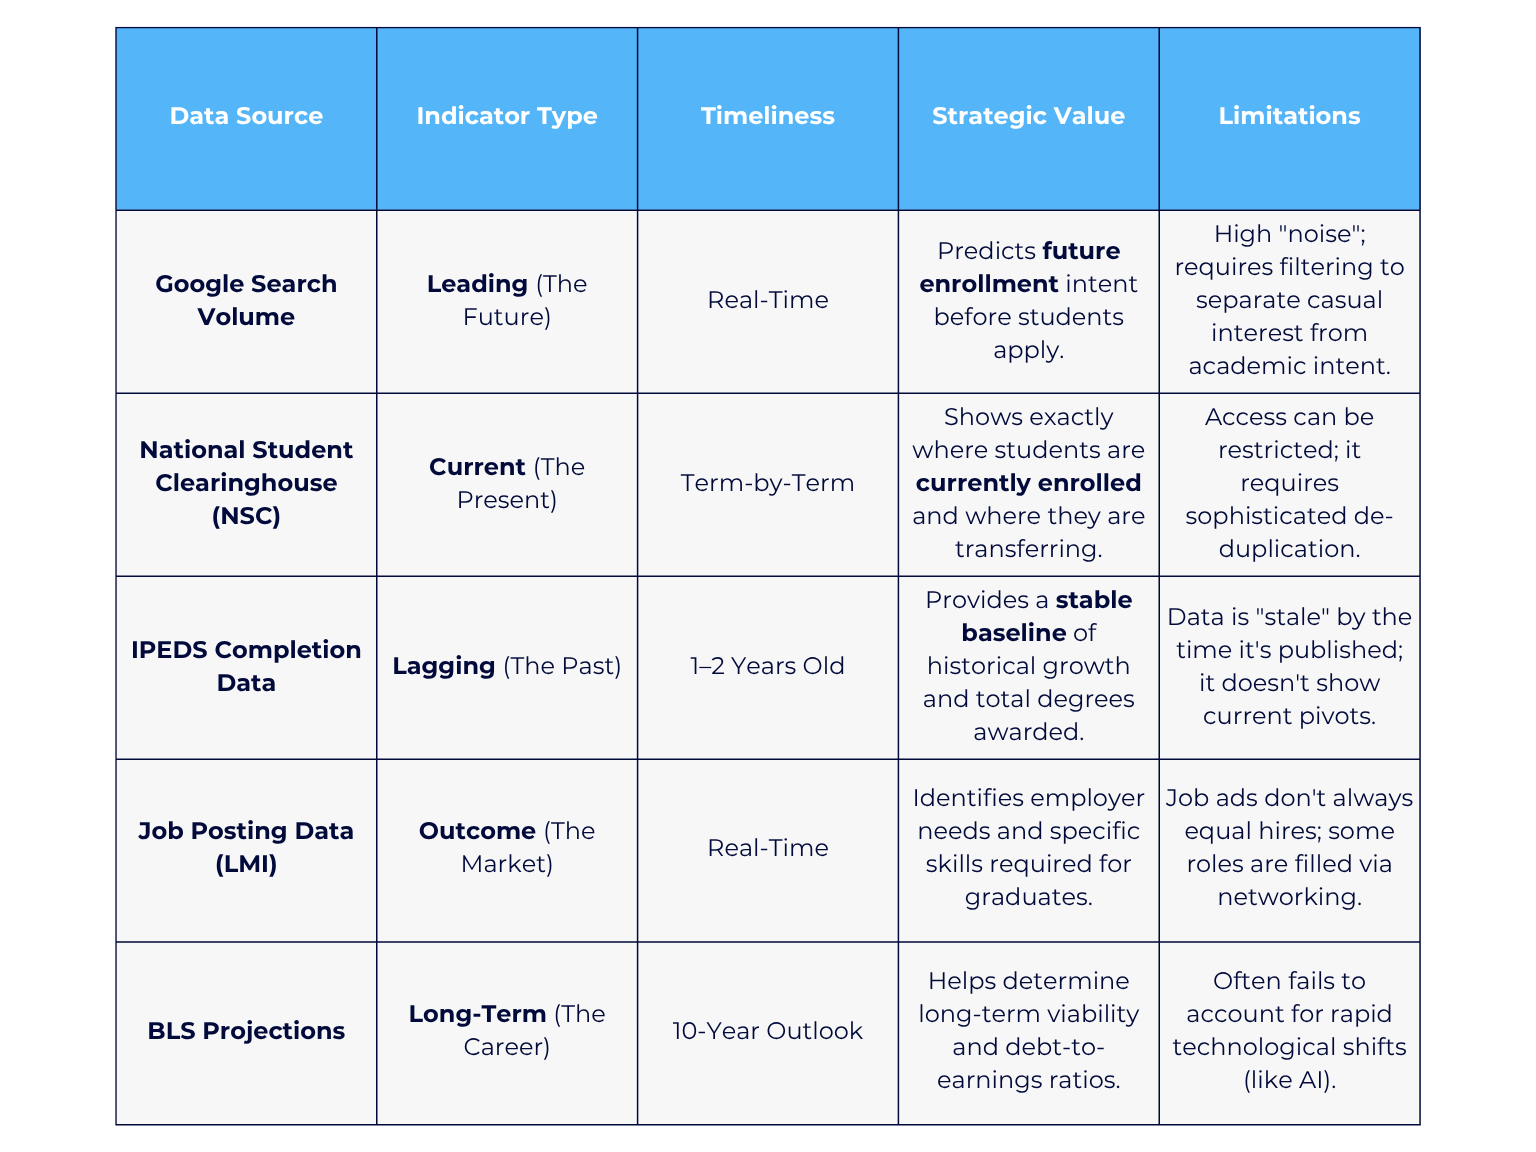
- Leading Indicators (Future): Analysis of Google Search volume for specific majors or degree levels. High search intent often precedes applications by 6–12 months.
- Current Indicators (Present): Data from the National Student Clearinghouse showing where students are currently enrolling.
- Lagging Indicators (Past): IPEDS (Integrated Postsecondary Education Data System) completion data, which shows how many students graduated in a specific field over the last few years.
2. Labor Market Alignment
A program may attract students, but it must also lead to viable careers to maintain institutional reputation and accreditation standards. Key metrics include:
- Job Postings: The total volume of postings that specifically require a degree in that field.
- Bureau of Labor Statistics (BLS) Projections: Ten-year growth forecasts for related occupations.
- Wage Outcomes: Ensuring graduates can earn sustainable wages.
3. Competitive Intensity
Even a high-demand field like Nursing or Cybersecurity can be a mediocre choice if the local market is oversaturated. Universities should analyze:
- Saturation Levels: How many other institutions in the same geographic or online “market” offer the same program?
- Median Program Size: If existing programs at rival schools are shrinking, it may signal a declining market despite high historical numbers.
- Cost of Recruitment: The Digital Marketing cost (Cost-Per-Click) to acquire a student in that specific field.
4. Institutional Economics
Finally, the university must determine if the program is financially sustainable. This involves calculating the Instructional Cost, the expense of faculty, specialized labs, and equipment, versus the projected tuition revenue. A program with high student demand but astronomical overhead may not be feasible.
Data Source Comparison: A Multi-Lens Approach
To get a complete picture of the market, a “multi-lens” approach is necessary. Relying on just one source often leads to an incomplete or outdated view. The following table illustrates how these data streams interact in the Gray Decision Intelligence methodology.
Comparison of Data Sources for Program Evaluation
Moving Beyond “Gut Feeling”
The modern standard for academic planning is a Program Evaluation System (PES). As outlined in the methodology by Gray DI, this system aggregates the data points above into a weighted scorecard. This allows provosts and deans to compare different academic programs using the same objective metrics.
The “Start, Stop, Grow” Strategy
The ultimate goal of measuring demand is not just to add new programs, but to manage the entire Academic Portfolio:
- Start: High demand, low competition, and strong job outcomes.
- Stop: Low student interest and poor employment prospects.
- Grow/Sustain: Programs that are “mission-critical” or show rising search intent but need more marketing support.
Summary for Academic Leaders
To determine demand, integrate search trends, completion data, and labor market statistics, universities can ensure that their new offerings meet the actual needs of both students and the workforce.