Somewhere in the multiverse, your institution is making a lot more money.
Despite my liberal arts background, I love science, from biology to quantum physics. I also have a secret appreciation for conspiracy theories that spring forth from a misinterpretation of our observable universe or advancing technology. But just as I do not believe CERN will not bump us into the next dimension every time it activates the Large Hadron Collider, I also disbelieve that successful academic program evaluation is based on one dimension of data. The fallacy of that has gotten many a school into trouble.
Labor Market Data Is Not Program Evaluation
Let’s look at some academic program planning decisions we might make when relying on data in one dimension: for example, using only labor market data to determine the programs we should start, stop or grow. It is just not enough information. You might find favorable data on job opportunities, but can you find students to fill seats?
Actuarial Science and Job Opportunity
What are the consequences of one-dimensional program evaluation? As an example, here is a drill down into a Bachelor’s of Actuarial Science program.
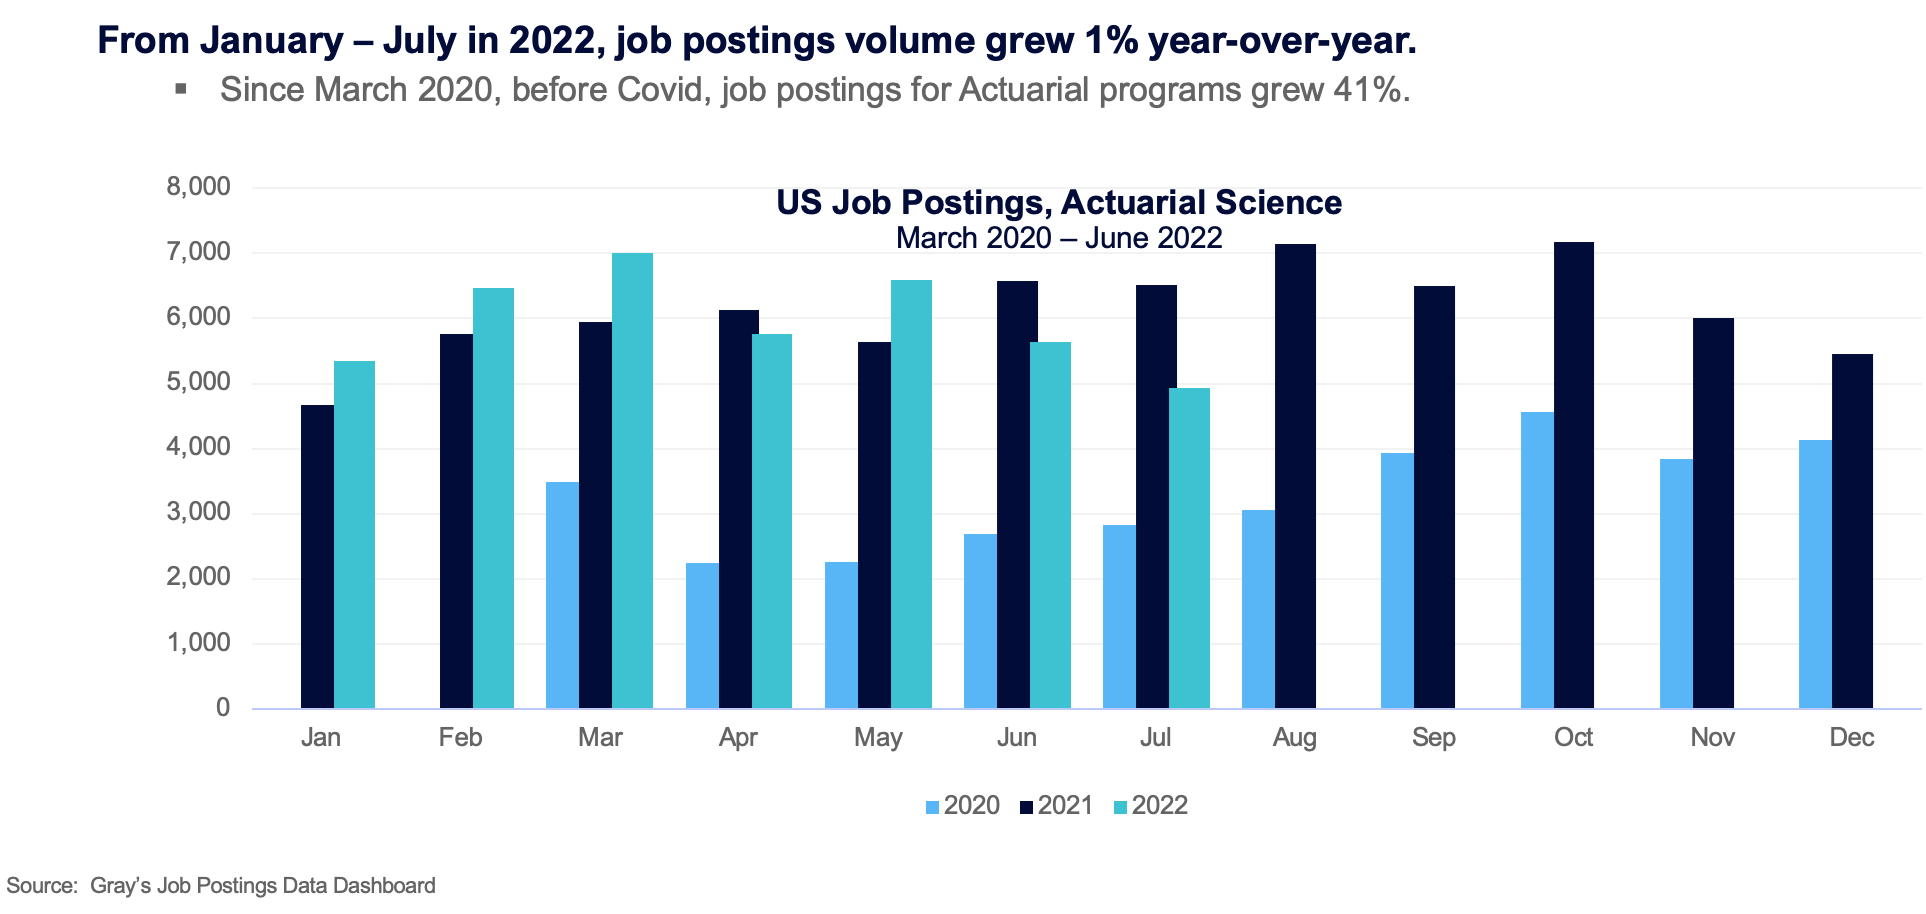
Jobs for Actuarial Science graduates are healthy and growing. In July alone, there were 4,925 job postings, with an average salary of $72,782. And according to the US Census’ American Community Survey, mid-career wages for actuarial scientists are over $170,000. Wow.

But wait, there is more. It’s important to look at student demand data before you jump ahead and start or grow this program. When you take into account student demand data, things don’t look quite as promising.
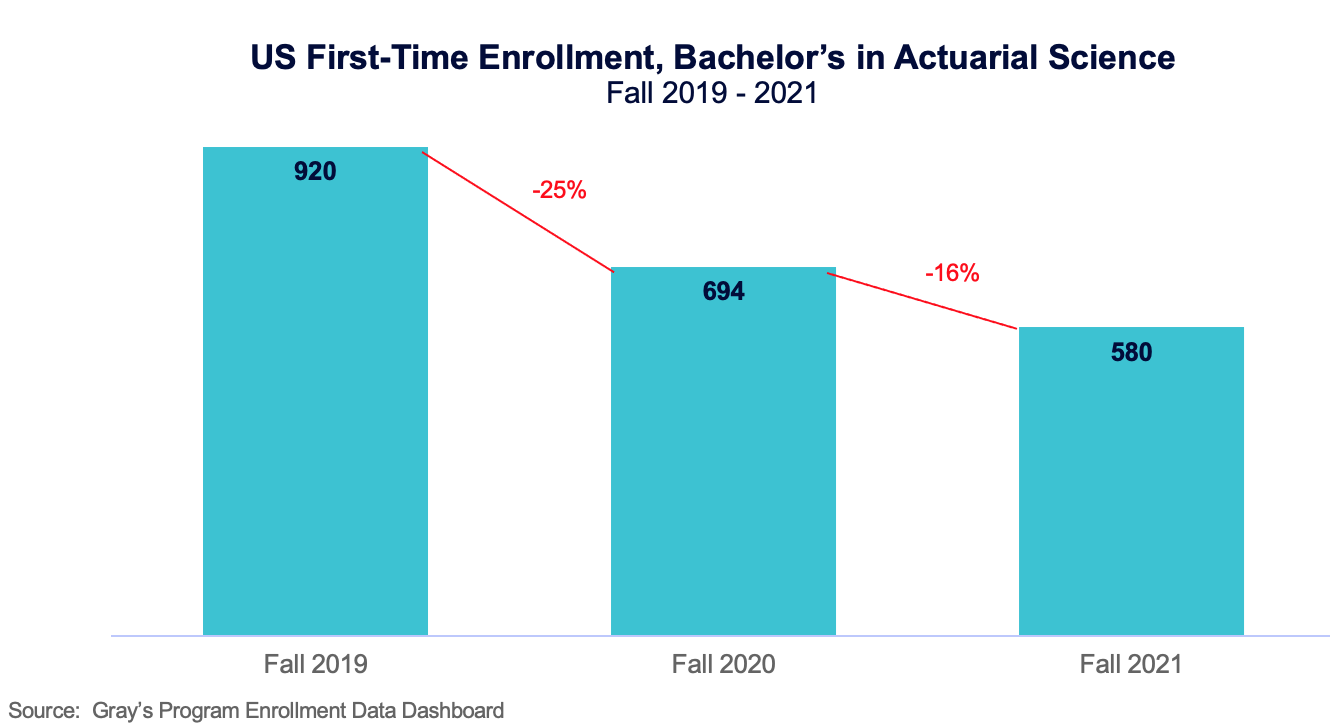
First-time enrollment in Bachelor’s of Actuarial Science programs declined 25% year-over-year in Fall 2020, and 16% year-over-year in Fall 2021.

Total fall enrollment also declined, falling 6% from fall 2019 to fall 2020, and 10% from fall 2020 to fall 2021.
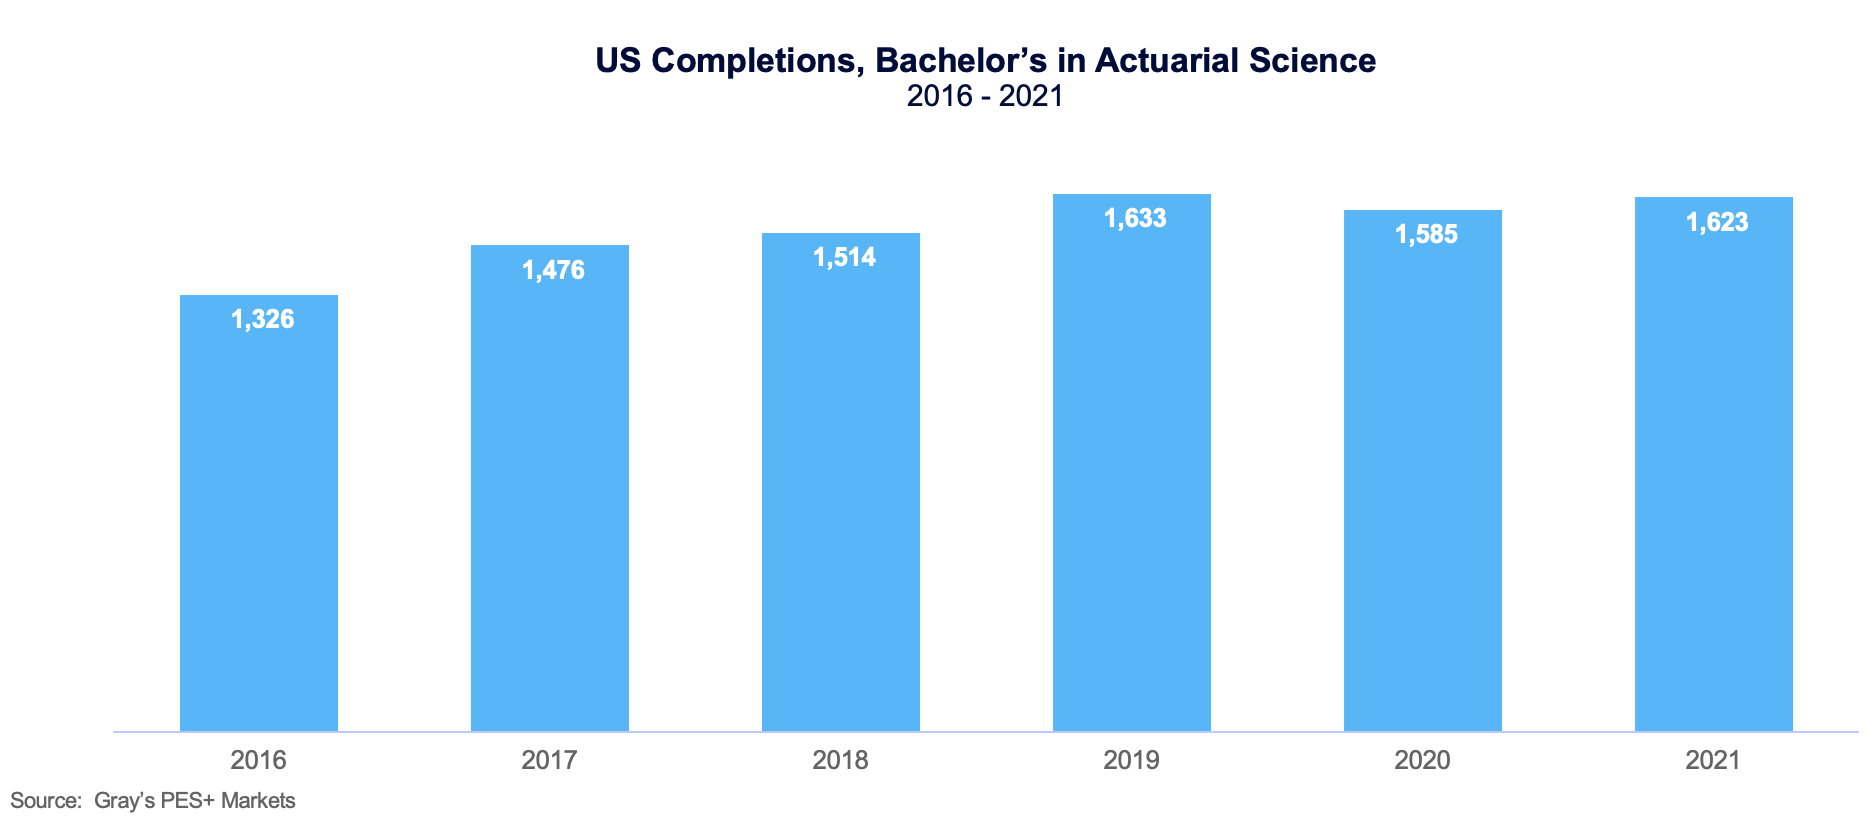
Completions have fared a bit better, peaking in 2019 but regaining momentum in 2021 after a 3% decline in 2020.

Another measure of student demand is Google keyword searches for Actuarial Science academic programs. While searches for Actuarial Science have grown by 5% from May – July 2022, the volume isn’t very high: 12,740 searches nationally in the same time period. Compared to over 1,400 academic programs, this volume lands Actuarial Science in the 56th percentile.
You may ask, wouldn’t a program with strong student demand AND employment be the perfect one to start or grow?
Maybe, but there is one more data set to consider before you give it the green light (presuming the program aligns with your mission and academic standards). You need to review market saturation or competitive intensity.
Accounting and Competitive Intensity
Let’s switch programs to illustrate why you need even more than just student demand and employment data. You need competition data too.
Accounting is a program with excellent student demand and employment opportunities. Google search volume was over 775,000 from May – July 2022 and rose 9% year-over-year. New student enrollment in the academic year 2020 – 2021 was over 10,000 students. Job opportunities are ample, with good wages. The catch: there were 1,051 campuses in the US that have graduated bachelor’s students in Accounting in 2020. The average number of completions per campus was 43, which isn’t bad, but the median was only 19 students, and it decreased 10% year-over-year. If this were a large program overall, there could be room in the market for another one; in this case, it is essential to look at who your competitors are in your market, as well as how many online programs are taking your potential students, since 15% of programs are online. Another sign of market saturation is Google cost-per-click; typically the higher cost-per-click, the more competitive the program. Accounting is $19 per click, higher than approximately 1,110 programs out of 1,400.
Cooking up an Accurate and Complete Program Evaluation
When planning your academic program portfolio, taking a look at labor data is indeed important, but I caution you to make sure your labor data sources are clean and current. Within labor market data, be careful about the sources you rely on. BLS forecasting and NCES CIP to SOC crosswalks can be misleading. I recommend you review these pieces by Bob Atkins on the subject:
BLS Labor Market Forecasts: A Weak Foundation for Academic Program Evaluation
Using Employment Data: The Direct Prep Fallacy
Your market data should include not only labor market demand but also student demand and competitive intensity. Programs with high employment opportunities may not have enough student demand to support them or to put it less delicately, programs with high employment opportunities for graduates won’t put butts in seats if students are not interested.


