
Why should you care what course enrollments cost? Aren’t content, student demand, and teaching and learning quality what really matter? These questions might be sensible if courses were never added to or removed from the curriculum, or if you never had to worry about budgets. Static or utopian worlds make detailed cost analyses less irrelevant. But we do not live in such worlds. New concepts and programs require new courses. Old offerings may become obsolete. Academic priorities, student demand, and funding may change. Crafting thoughtful academic responses requires insight about the effects of your decisions on course cost. Current best practice estimates total course costs by allocating faculty members’ compensation and ancillary expenses across the courses they teach, then adding direct non-personnel charges and certain overheads. Dividing the result by enrollment yields the average cost (AC). While using AC is much better than flying blind. However, my recent research has shown that using AC to predict the cost of enrollment growth, or the savings from enrollment shrinkage, produces considerable error variance. Worse, the errors may either over- or underestimate the true effect of enrollment change. While oversimplified, the example conveys an essential point. Average cost (AC) can be an unreliable guide for deciding whether to grow particular courses—and also particular programs. What you really need is the incremental cost of enrollment change (∆C).
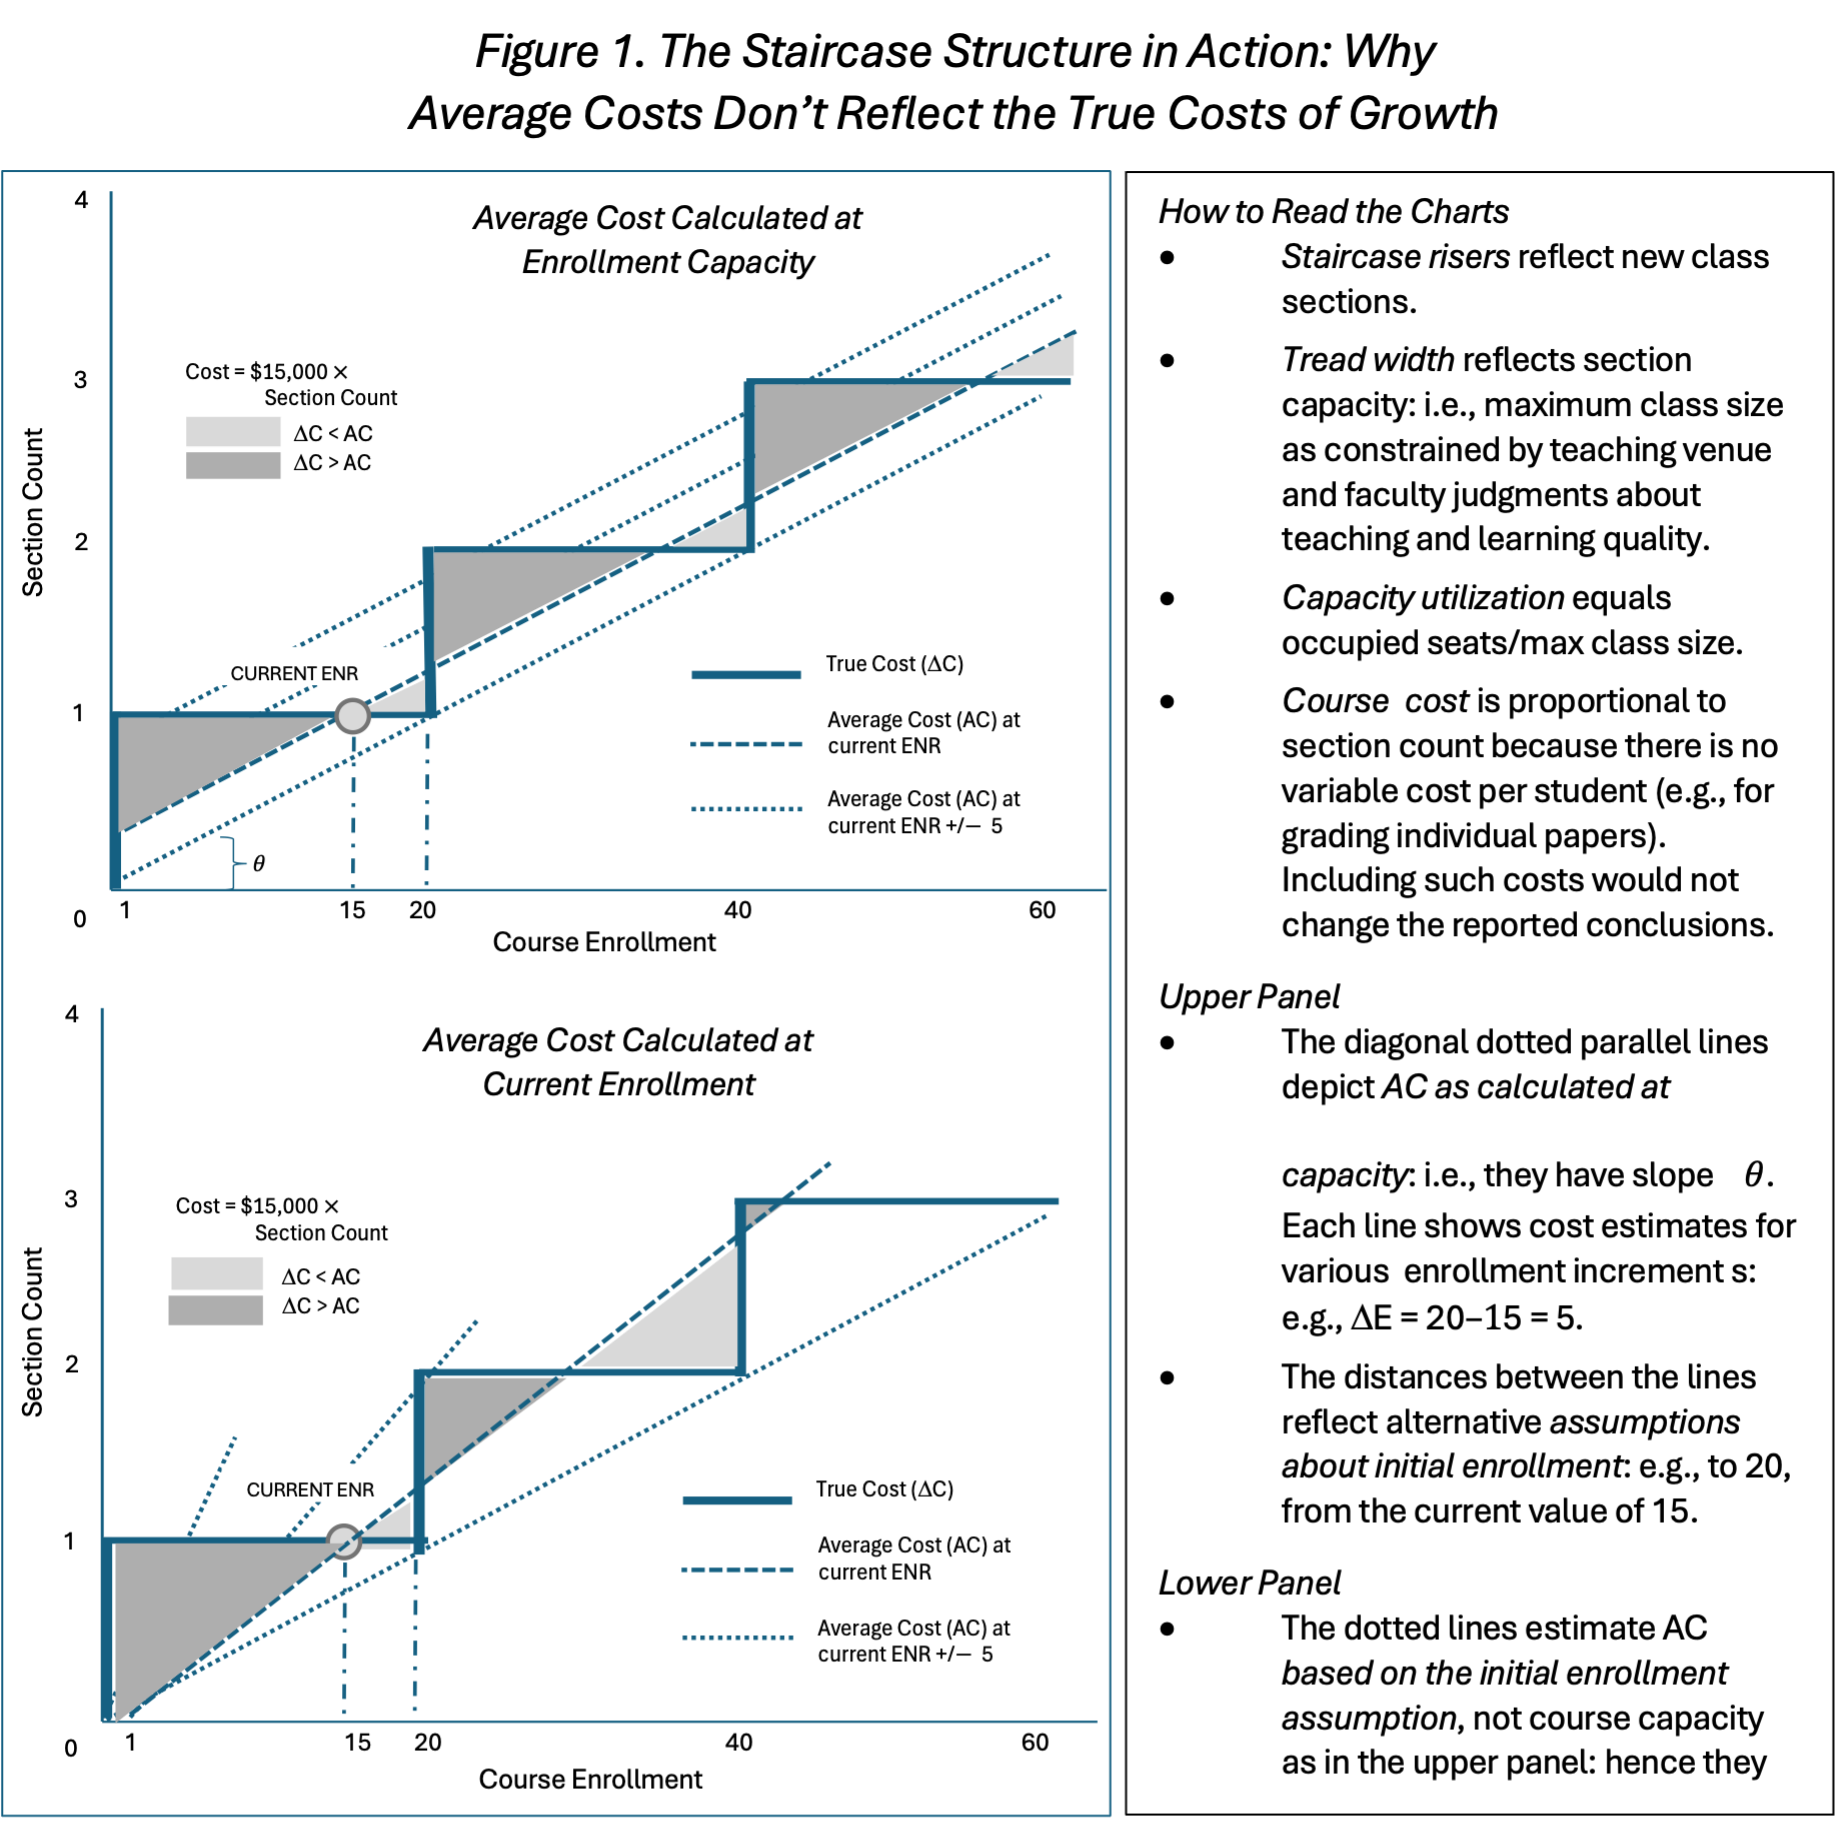 The experiment compares alternative enrollment levels, all of which exhibit considerable error variances. It illustrates the variances in average cost estimation.
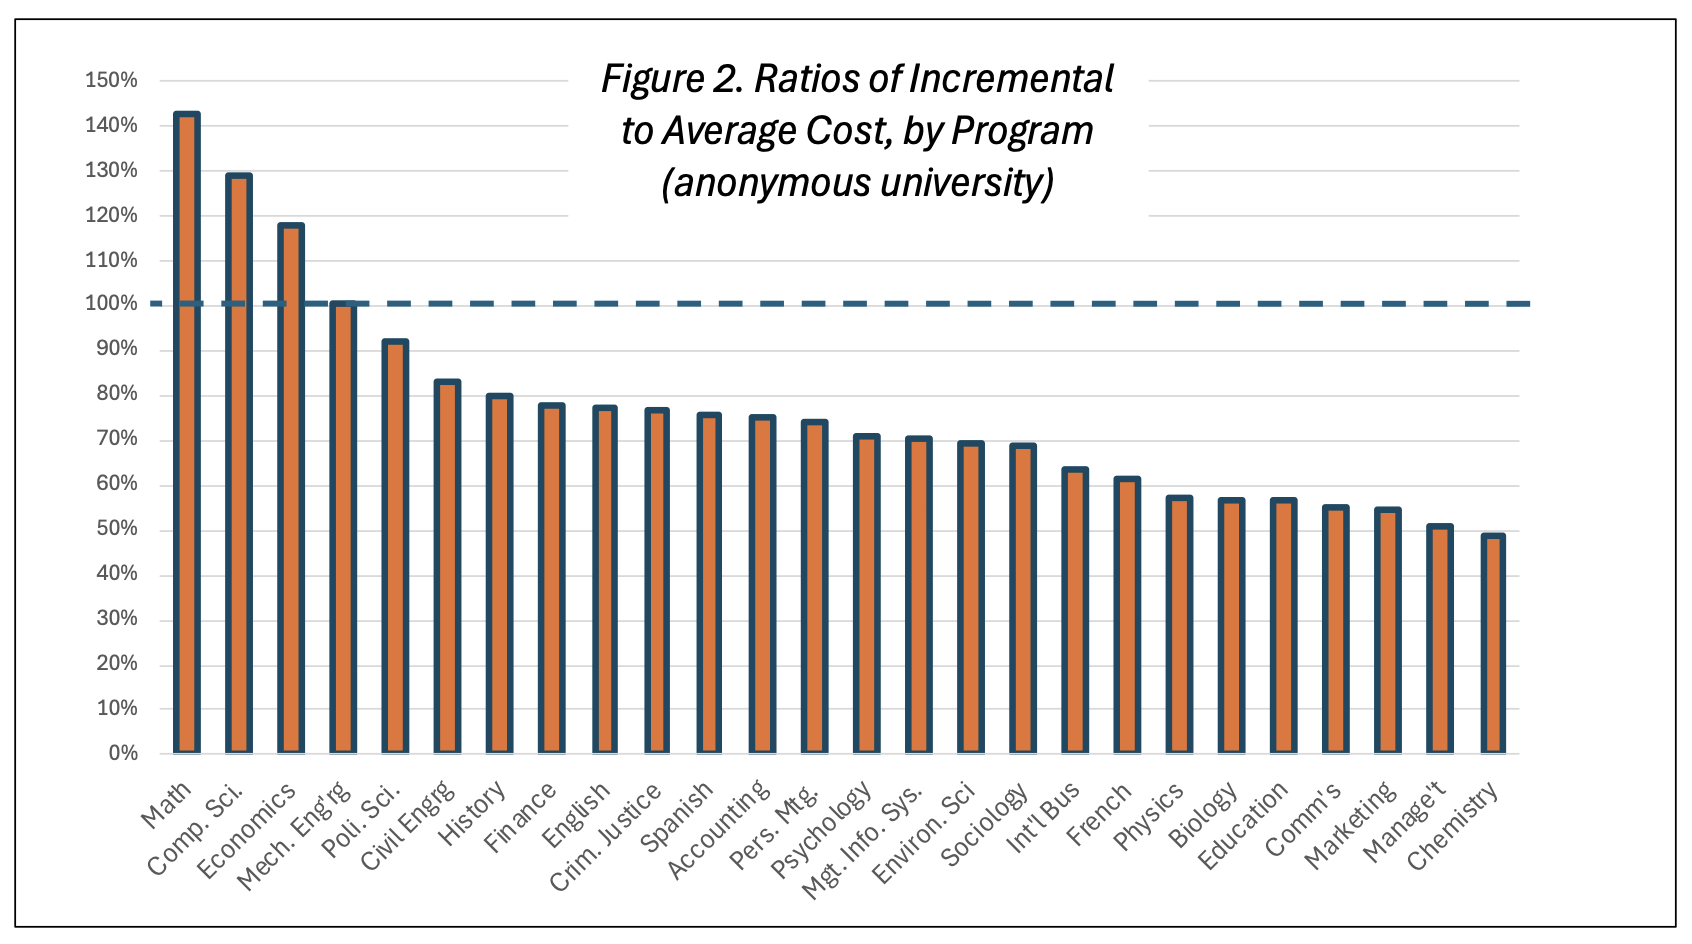 These errors are large enough to matter. At the left of the chart, average cost overestimates true cost by up to 40%. On the right, the underestimates run to 50%. These figures are substantial fractions of the cost differences among programs. In other words, decisions based on relative average program cost are subject to substantial error. The costing errors translate directly to errors in predicted margins. Revenue is measured with little error, but costs are not. Hence, the absolute estimated economic effects matter as well as the relative ones. The effects of variance may cancel each other to some extent, but the biases are transmitted to budgetary income estimates. Every university counts on surpluses generated by some programs to cross-subsidize losses incurred by others—indeed, it is these cross-subsidies that allow institutions to assert their instructional priorities. Furthermore, instruction as a whole must support a portion of the institution’s central administration and support services. Decision makers need to know enough about cost to balance these factors while furthering their overall academic goals. Academic leaders and Board members can’t afford to accept materially uncertain or biased income estimates in budget proposals.
A Simple Example
Let’s consider this simple scenario. Your academic plan calls for growing a certain course by 5 to 10 students. The course has a current enrollment of 15 students, a maximum section size (“capacity”) of 20, a section cost of $15,000, and zero cost for adding up to 5 students to an existing section. Its average cost per student is $15,000/15 = $1,000 per enrollment. Cost-conscious institutions might calculate the cost of enrollment growth as ∆ENR AC where “∆“ means “change.” This predicts the growth cost for 5 and 10 students as $5,000 and $10,000, respectively. Easy enough, but what really happens is:- If five more students enroll, the added instructional cost is zero.
- But if enrollment increases by six students (enough to require another section), the cost jumps by $15,000.
While oversimplified, the example conveys an essential point. Average cost (AC) can be an unreliable guide for deciding whether to grow particular courses—and also particular programs. What you really need is the incremental cost of enrollment change (∆C).“Staircases” for Course Cost
Figures 1 and 2 depict the relation between enrollment and course cost in what I’ve come to call a “staircase”. This represents situations where students are taught at least partly in groups that meet periodically with an instructor. This approach has proven to be the most efficient method for teaching concepts and skills, at scale, in face-to-face, online, and hybrid situations. Figure 1’s upper panel shows a thought experiment where average cost is measured at the course’s capacity, not at its current enrollment, as shown above. That is, AC equals $15,000/20 = $750 rather than $1,000. This symmetric situation provides a more understandable introduction than the more complicated one shown in the lower panel, which is found in real universities. The experiment compares alternative enrollment levels, all of which exhibit considerable error variances. It illustrates the variances in average cost estimation.- E0 = 15, 75% capacity (current enrollment as in our previous example). The AC-based and true cost estimates for adding five and ten enrollments can be read from the above Table. The large solid triangles represent the ∆E increments where AC underestimates ∆C, sometimes by large amounts. Overestimation can occur too (the lightly shaded triangles), but the underestimates are more frequent.
- E0 = 20, full capacity. The initial enrollment has been moved rightward to the point where there are no empty seats. The lightly shaded triangles have disappeared. AC underestimates ∆C for every enrollment increment.
- E0 = 10, 50% capacity. The initial enrollment has been moved leftward to where half the seats are empty. The solid and shaded triangles are equal. The system is symmetric, but the error variance remains high.
- E0 = 5, 25% capacity. The initial enrollment has been moved leftward again, to where only a quarter of the seats are filled. This is the opposite of case (1). Average costs are likely to underestimate true costs.
Conclusions
We’ve seen that the relation between average and incremental cost varies widely, depending upon the circumstances. However, some generalizations are possible.- The variance between estimates based on average cost (AC) and true cost (∆C) can be quite large.
- AC-based estimates are mostly biased toward overestimation.
- Significant underestimation is also possible, however. This adds to the uncertainty.
- The bias is largest for single-section courses and for courses with low capacity utilization.
These errors are large enough to matter. At the left of the chart, average cost overestimates true cost by up to 40%. On the right, the underestimates run to 50%. These figures are substantial fractions of the cost differences among programs. In other words, decisions based on relative average program cost are subject to substantial error. The costing errors translate directly to errors in predicted margins. Revenue is measured with little error, but costs are not. Hence, the absolute estimated economic effects matter as well as the relative ones. The effects of variance may cancel each other to some extent, but the biases are transmitted to budgetary income estimates. Every university counts on surpluses generated by some programs to cross-subsidize losses incurred by others—indeed, it is these cross-subsidies that allow institutions to assert their instructional priorities. Furthermore, instruction as a whole must support a portion of the institution’s central administration and support services. Decision makers need to know enough about cost to balance these factors while furthering their overall academic goals. Academic leaders and Board members can’t afford to accept materially uncertain or biased income estimates in budget proposals.